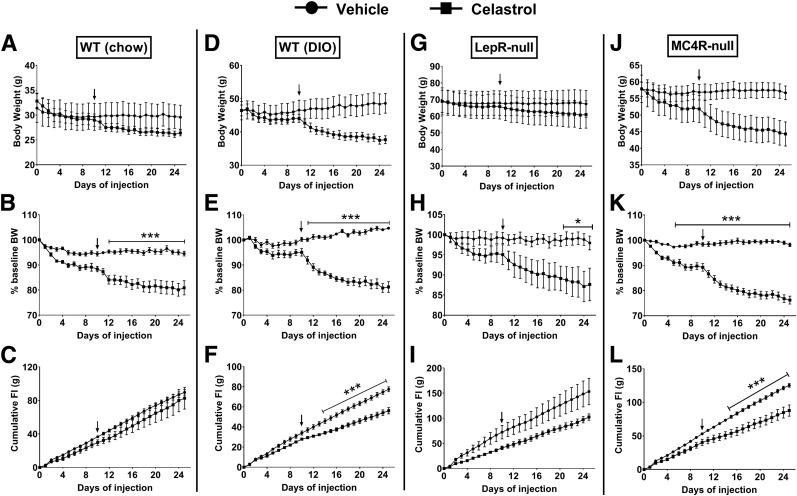
Figure 1.
The effects of systemic celastrol on body weight and food intake. A, D, G, and J: Absolute changes of body weight in grams. B, E, H, and K: Percentage changes of body weight (BW). C, F, I, and L: Cumulative food intake (FI) in chow-fed WT, DIO, LepR-null, and MC4R-null mice (n = 4–6/group). Arrows indicate the time when dose of celastrol was increased to 0.5 mg/kg from 0.1 mg/kg. Data are presented as mean ± SEM. *P < 0.05, ***P < 0.001 by two-way ANOVA compared with vehicle group.

