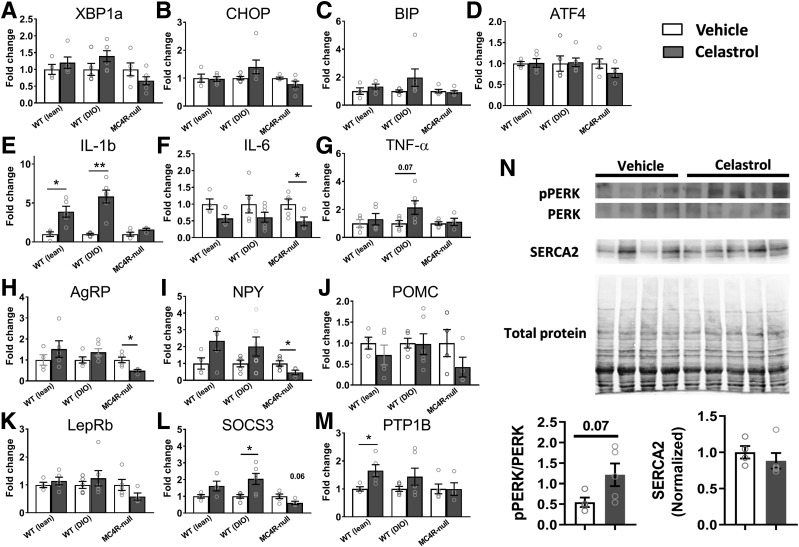
Figure 3.
Changes of the levels of gene expressions in the hypothalamus by celastrol. A–D: Expression levels of genes involved in ER stress. E–G: Expression levels of inflammatory cytokine genes. H–J: Expression levels of neuropeptides involved in homeostatic regulation of energy balance. K–M: Expression levels of genes involved in leptin signaling. N: pPERK and SERCA2 protein levels in the hypothalamus. Data are presented as mean ± SEM. *P < 0.05, **P < 0.01 by Student t test compared with vehicle group.

