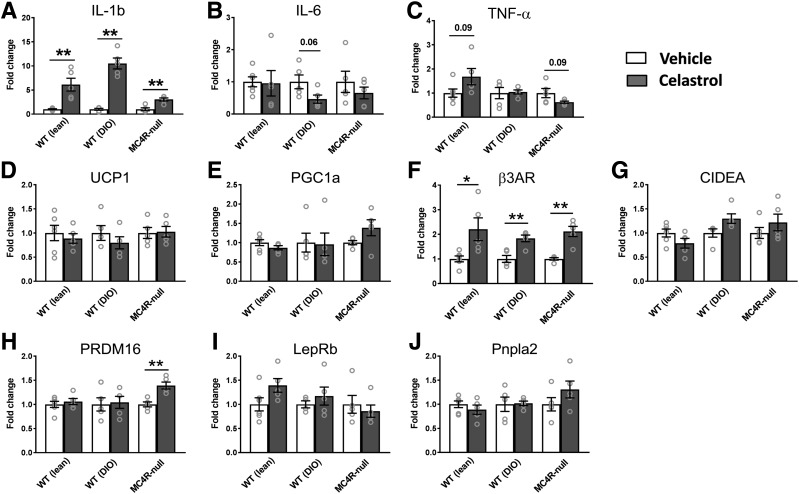
Figure 4.
Changes of the levels of gene expressions in iBAT by celastrol. A–C: Expression levels of genes involved in ER stress. D–J: Expression levels of genes involved in thermogenesis, lipolysis, and adipocyte differentiation (N = 4–6/group). Data are presented as mean ± SEM. *P < 0.05, **P < 0.01 by Student t test compared with vehicle group.

