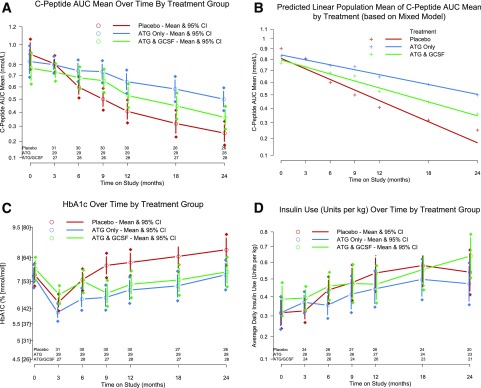
Figure 2.
Effects of low-dose ATG and low-dose ATG/GCSF on C-peptide (A), mixed-model predicted C-peptide (B), HbA1c (C), and insulin (D). C-peptide AUC mean over time by treatment group (A). Analysis at the 2-year end point: ATG alone vs. placebo P = 0.0005 and ATG/GCSF vs. placebo P = 0.032. Mixed-model predicted population mean of the C-peptide AUC mean by treatment over time (B). Two-year decline in mean C-peptide AUC mean: placebo −0.635 nmol/L, ATG −0.337 nmol/L, and ATG/GCSF −0.446 nmol/L. HbA1c over time by treatment group (C). Analysis at 2-year end point: ATG alone vs. placebo P = 0.011 and ATG/GCSF vs. placebo P = 0.022. Insulin use over time by treatment group (D). No significant differences at 2 years. A, C, and D show adjusted means and 95% CIs at each time point; B shows the mixed-model predicted population mean of the C-peptide AUC mean by treatment. Two-year decline was −0.635 nmol/L, −0.337 nmol/L, and −0.446 nmol/L in placebo-, ATG-, and ATG/GCSF-treated subjects, respectively.

