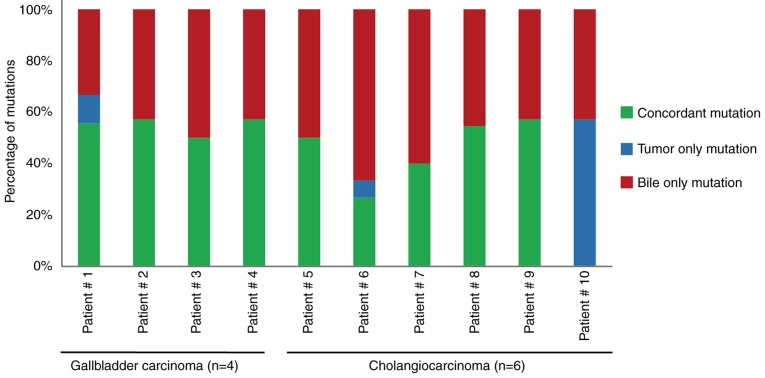
Figure 3.
Mutational concordance between paired bile cfDNA and tumor tissue DNA samples from ten BTC patients. Green depicts the proportion of concordant mutations in a given patient, while mutations that are exclusively tumor- or bile-associated are depicted by blue or red, respectively. cfDNA, bile cell-free DNA; BTC, biliary tract cancer.

