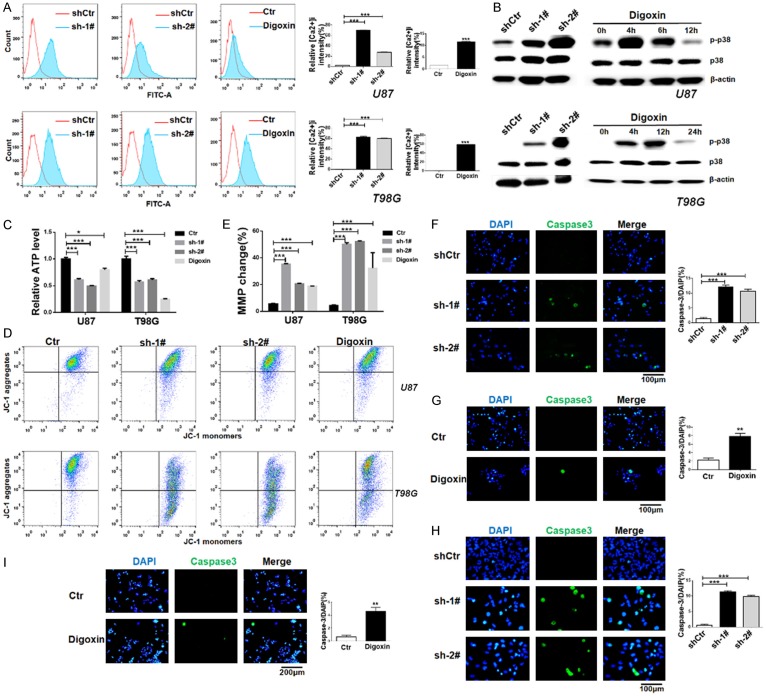
Figure 5.
ATP1B2 downregulation increases intracellular calcium ([Ca2+]) levels and activates p38 mitogen-activated protein kinase (MAPK) pathway. (A) [Ca2+]i concentration was quantified using the calcium indicator Fluo-3AM using flow cytometry. U87 and T98G cells were infected with short-hairpin control (shCtr) or shATP1B2-1# and 2# and treated with digoxin. Quantifications are shown at the right. Data are means ± SD, *, P < 0.05 and ***, P < 0.001. (B) Phosphorylated-p38 (p-p38) kinase and total p38kinase were detected using western blotting using specific antibodies. β-actin was the loading control. U87 and T98G cells were infected with shCtr or shATP1B2-1# and 2# and treated with digoxin at indicated times. (C) Cellular ATP levels in U87 and T98G cells after ATP1B2 downregulation and digoxin treatment. Values represent relative mean ATP levels ± SD (*, P < 0.05, ***, P < 0.001). (D, E) Mitochondrial membrane potential (MMP) was quantified by JC-1 using flow cytometry (D). (E) Quantifications are shown at upper panel. Data are means ± SD, *, P < 0.05 and ***, P < 0.001. (F-I) Activation of caspase-3 was detected using specific antibody for cleaved-caspase3 using immunofluorescence after ATP1B2 downregulation and digoxin treatment of (F, G) U87 and (H, I) T98G cells. Quantifications are shown at the right. Data are means ± SD, *, P < 0.05 and ***, P < 0.001.

