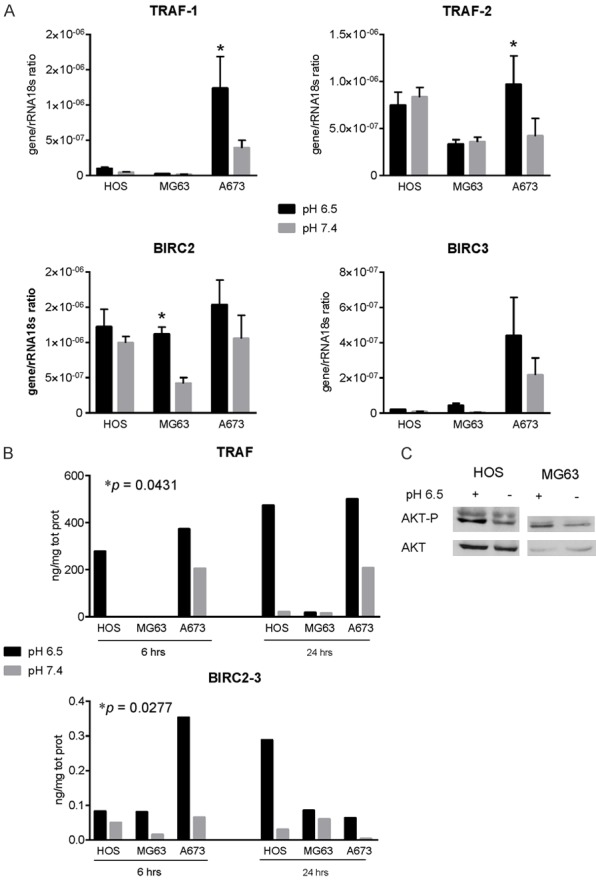
Figure 4.

Extracellular acidosis promotes the induction of BIRC and TRAF expression. A. RT-qPCR analysis of the TRAF1 and 2 and of the BIRC2 and 3 expression in cells treated at the same condition of Figure 3A. Mean ± SE (n = 5, *P < 0.05); B. Protein quantification of TRAF and BIRC family of proteins in cells treated at the same condition of Figure 3A (statistical paired analysis, *P < 0.05), for 6 and 24 h. Mean ± SE (n = 3, P was obtained by Wilcoxon Rank paired analysis considering each osteosarcoma cell line as a single value); C. Western blot of AKT and the phosphorylated form in cells treated with acid medium (pH 6.5) for 24 h.
