FIGURE 7.

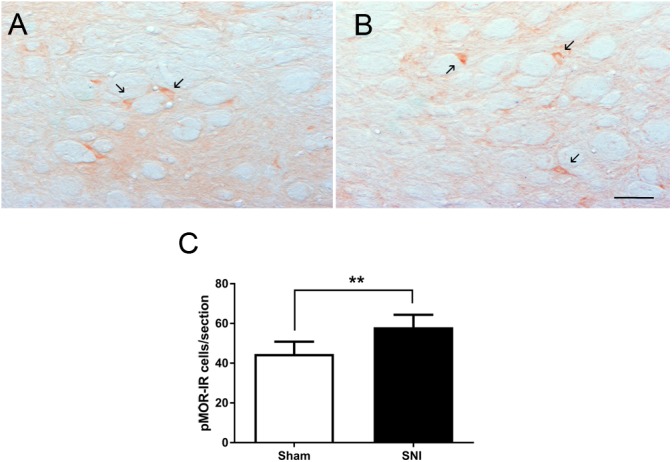
Neuropathic pain increases pMOR expression at the DRt. Representative photomicrographs of pMOR-immunoreactive (IR) cells at the DRt of sham- (A) and SNI- (B) animals. Typical pMOR immunolabeling is marked by arrows. Scale bar in (B): 100 μm (A is at the same magnification). Data in (C) represents the number of pMOR-IR cells at the DRt of sham- and SNI- animals (n = 6/group). Data in C are presented as mean ± SD. ∗∗p < 0.01.
