Fig. 4.
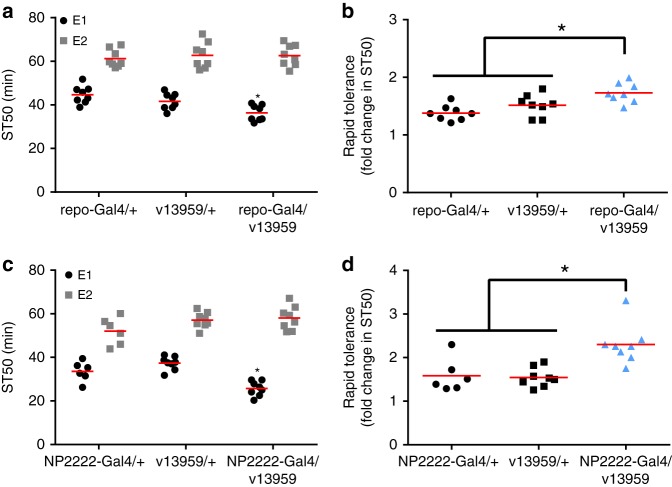
Cp1 in rapid tolerance development. a ST50 values from the first (E1) and second (E2) ethanol exposure when Cp1 is knocked down in all CNS glia. Compared to controls (repo-Gal4/+ and v13959/+), expression of Cp1 RNAi in CNS glia (repo-Gal4/v13959) decreased ST50 values during E1, but not during E2 (two-way ANOVA; genotype, n.s.; ethanol exposure, p < 0.0001; interaction, p = 0.015; *Bonferroni’s multiple comparisons vs. controls for each ethanol exposure, p < 0.05; n = 8). b Development of rapid tolerance (fold change in ST50 from E1 to E2) quantified from the data in a. Expression of Cp1 RNAi in glia (blue bar: repo-Gal4/v13959) increased rapid tolerance development compared to controls (black bars: repo-Gal4/+, v13959/+) (one-way ANOVA, p = 0.0014; *Bonferroni’s multiple comparisons vs. controls, p < 0.05; n = 8). c ST50 values from the first (E1) and second (E2) ethanol exposure when Cp1 is knocked down in cortex glia. Compared to controls (NP2222-Gal4/+ and v13959/+), expression of Cp1 RNAi in cortex glia (NP2222-Gal4/v13959) decreased ST50 during E1, but not during E2 (two-way ANOVA; ethanol exposure, p < 0.0001; genotype, p = 0.0034; interaction, p = 0.0001; *Bonferroni’s multiple comparisons vs. controls for each ethanol exposure, p < 0.05; n = 8). d Development of rapid tolerance (fold change in ST50 from E1 to E2) quantified from the data in c. Expression of Cp1 RNAi in cortex glia (blue bar: NP2222-Gal4/v13959) increased rapid tolerance development compared to controls (black bars: NP2222-Gal4/+, v13959/+) (one-way ANOVA, p = 0.0009; *Bonferroni’s multiple comparisons vs. controls, p < 0.05; n = 8)

