Fig. 3.
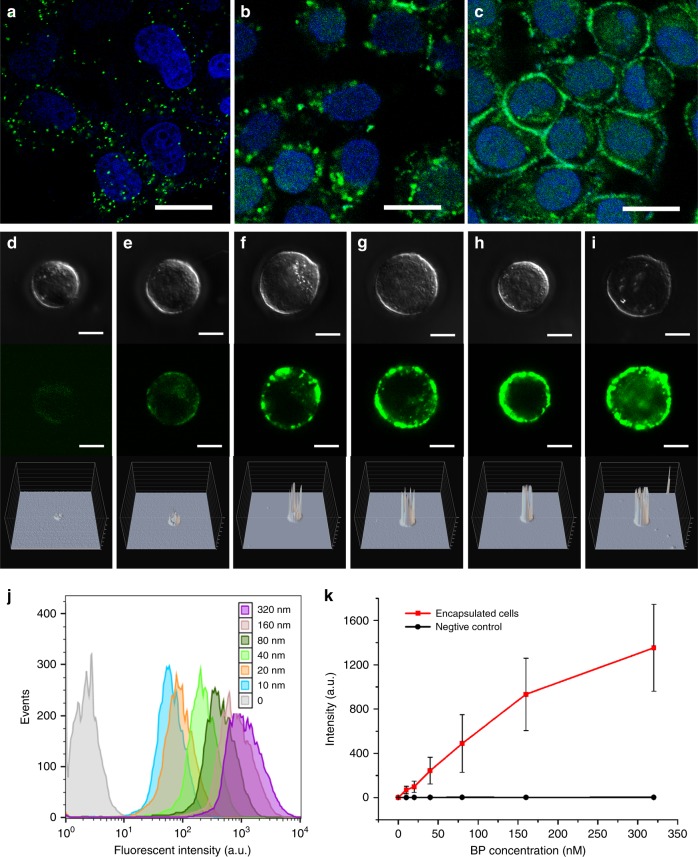
Fabrication of DNA cocoons on cells. a−c Confocal fluorescence microscopy images show the grafted DNA polymers on MCF-7 cells. The influence of the R1 and R2 reactions are investigated at low concentration of 10 nM IP, where image (a) shows the solely conducted R1, and image (b) shows the coupled R1R2 reactions. Image (c) shows the R1R2 reactions when the IP concentration is 150 nM. The cell-surface-grafted DNA polymers are imaged after labeling with FAM-modified oligonucleotides (green). Attached MCF-7 cells are used for the fluorescent observation in the culture dish. Scale bars, 20 μm. d−i Differential interference contrast (DIC) and confocal fluorescence microscopy images of the individual encapsulated MCF-7 cells, revealing the influence of R2 on the formation of the DNA cocoon. The concentrations of the BP in R2 are 10, 20, 40, 80, 160, and 320 nM. The bottom row shows the analysis of the fluorescent intensities, indicating the gain of DNA polymers densities in the DNA cocoon. Scale bars, 10 μm. j, k Flow cytometric evaluation of the polymer density of the DNA cocoons on the MCF-7 cells. The above BP with concentrations of 10–320 nM are used for the cell encapsulation with isDOP. Source data are provided as a Source Data file. The error bars indicate the standard deviation of 10,000 cell events at each concentration

