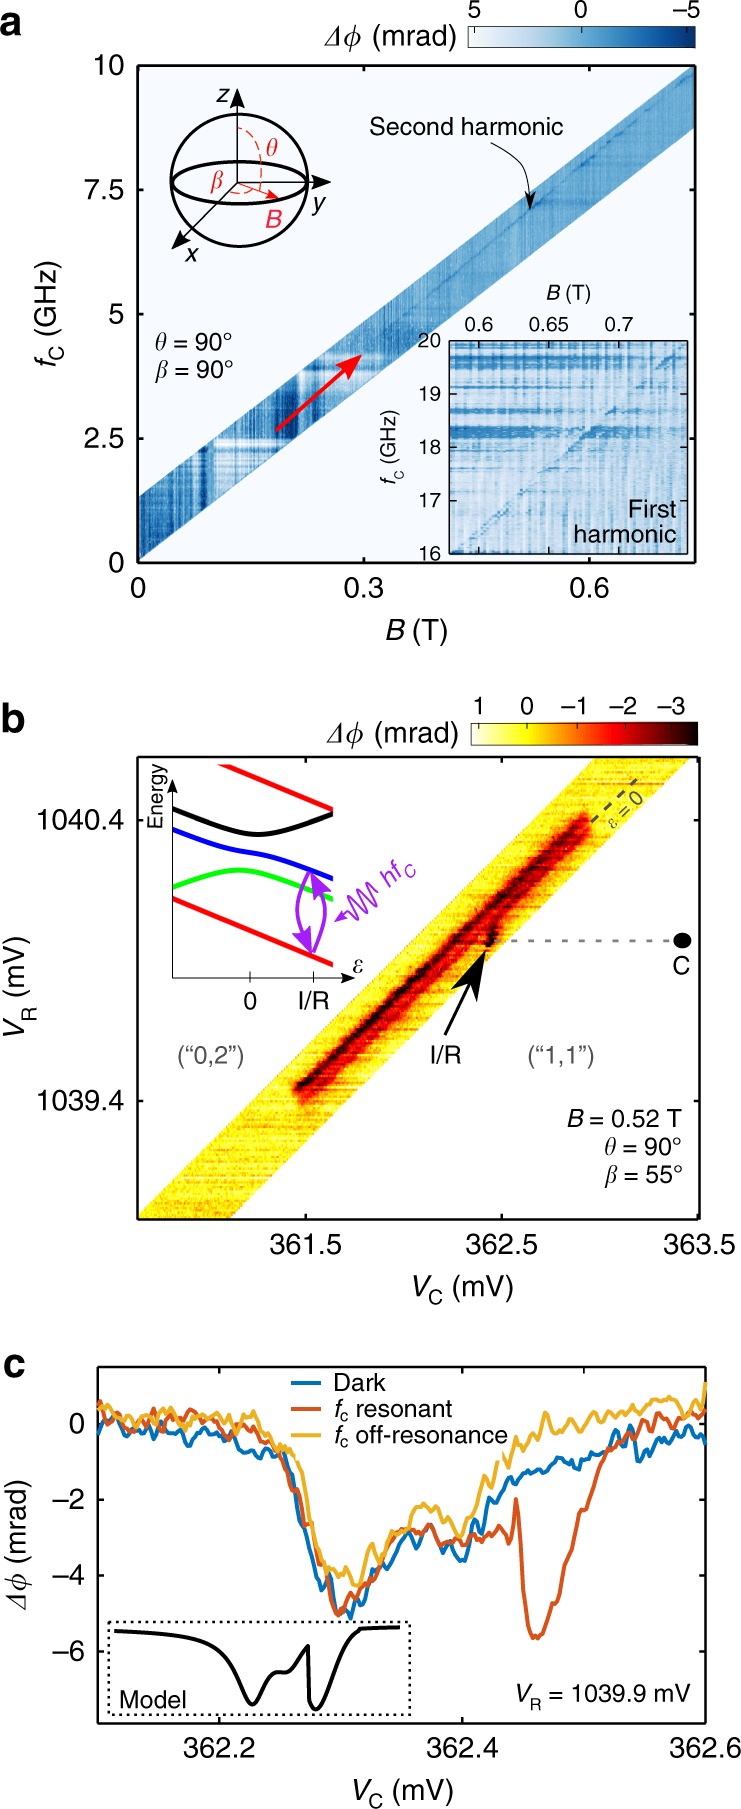
Fig. 3.

Experimental detection of electric-dipole spin resonance (EDSR). a Phase response as a function of B and microwave frequency fC. B is oriented along the y direction with respect to the frame of Fig. 1a. The linear phase ridge denoted by a red arrow is a characteristic signature of EDSR. It corresponds to a second-harmonic signal, while the much weaker first harmonic is shown in the lower inset. b Stability diagram at B = 0.52 T (orientation β = 55° and θ = 90° according to the diagram in upper inset of a) with fC = 7.42 GHz and microwave power PC ≈ −80 dBm. EDSR between T−(1, 1) and T0(1, 1) (purple arrows in inset) is driven at point I. In the stability diagram, the change of population induced by EDSR is visible as a localized phase signal at point I/R. c Phase shift at VR = 1039.9 mV as a function of VC without microwave irradiation (dark), and under on-resonance and off-resonance excitation at fC = 7.42 and 7.60 GHz, respectively. EDSR-stimulated transitions appear as a pronounced peak whose position and line shape are compatible with our model (inset)
