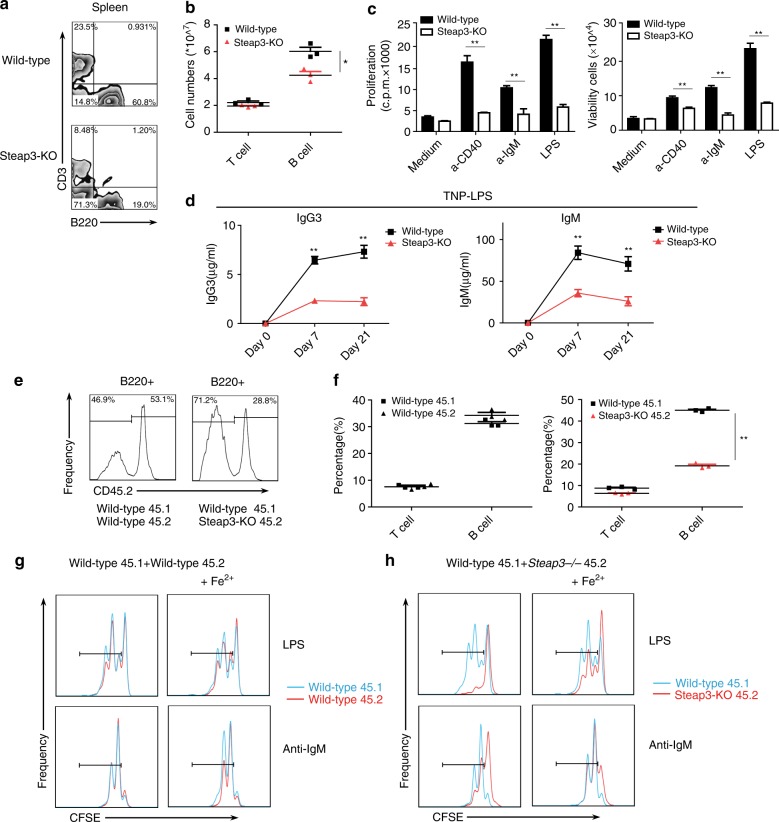
Fig. 3.
Defective mature B-cell population and proliferation in Steap3-KO mice. a Flow cytometry of splenocytes from wild-type and Steap3-KO mice was used to identify CD3 + T cells and B220 + B cells. b Statistics for the numbers of splenic B and T cells in the two groups (mean ± SEM of three mice per group). c Wild-type or Steap3-KO splenic B cells were stimulated with anti-CD40 (1 μg/ml), anti-IgM (10 μg/ml), or LPS (2 μg/ml), and proliferation was assessed by [3H] thymidine incorporation (b, top). Viable B cells were counted 48 h after stimulation (b, top). d ELISA to check antigen-specific antibody responses of wild-type and Steap3-KO mice 7 days and 21 days after immunization with TNP-LPS (the data represent the mean ± SEM of four mice per group). CD45.1 + wild-type bone marrow cells were mixed 1:1 with CD45.2 + wild-type or Steap3-KO bone marrow cells and cotransferred into irradiated wild-type C57BL/6J recipient mice. Six weeks later, e flow cytometry of splenocytes from recipient mice was conducted to compare the quantity of CD45.1 + wild-type B cells with that of CD45.2 + wild-type or Steap3-KO B cells. The splenocytes were further stained with anti-CD21 and anti-CD23 antibodies to evaluate MZB cells and FOB cells. f Statistics obtained for CD45.1 + or CD45.2 + T cells and B cells in the spleens of recipient mice (mean ± SEM of three mice per group). g, h Splenic B cells from recipient mice containing CD45.1 + and CD45.2 + B cells were labeled with CFSE, cultured and stimulated with anti-IgM (10 μg/ml) or LPS (2 μg/ml). The right panel shows the results after additional Fe2 + (ferrous iron) was added to the medium. B-cell proliferation was assessed by CFSE dilution, and the portion of cells that underwent at least one cellular division are outlined. The data were representative of three mice or two independent experiments. *P < 0.05, **P < 0.01, Student’s t-test

