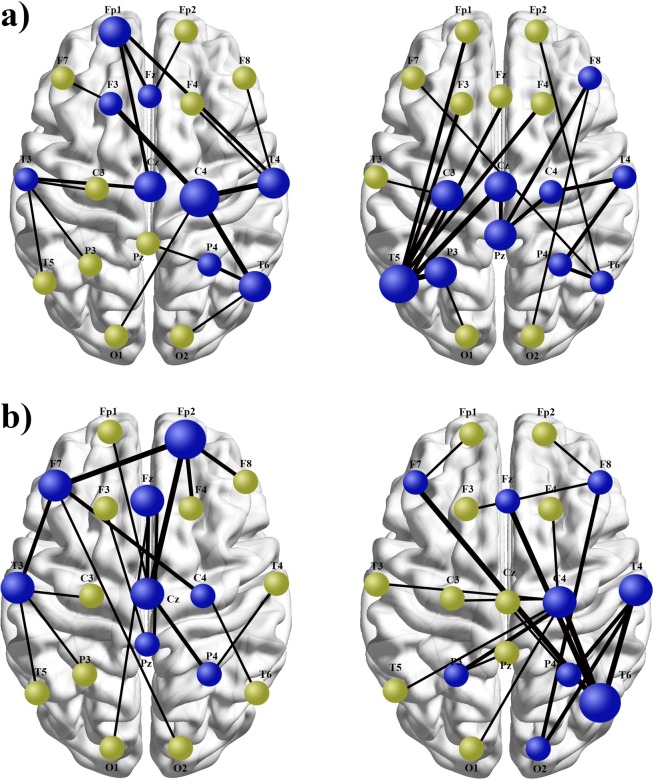
Figure 3.
An illustrative comparison of the MST topologies differing with respect to: increased and decreased maximal betweenness centrality (a), and comparison of regionally diversified topologies with regard to betweenness centrality of nodes located in anterior versus posterior areas (b). Blue nodes are hubs, while light green nodes are leafs. The thickness of the lines corresponds to functional connectivity values based on the phase lag index algorithm. (a). Topography on the right side contains severely overloaded central hub (T5 electrode) positioned in the left temporal lobe, directly connected to seven other nodes. Compared with this substantially centralized topology, network organization showed on the left does not lead to hubs overloading, due to more balanced and dispersed distribution of connections between individual nodes. (b). The organization shown on the right contains more hubs located in the posterior part of cortical surface, especially in the right temporal and parietal lobes. The central hub, with the maximal BC in the entire network is located in the right temporal lobe (electrode T6). The topology displayed on the left contains more hubs in the anterior area and the central hub positioned within the right prefrontal cortex (electrode Fp2). Shown topologies were reconstructed according to pipeline presented in Fig. 1., on the basis of MST results obtained from our SZ patients (on the right) and healthy controls (on the left) in beta (a) and gamma (b) frequencies (see Supplementary Information: Figs S1 and S2. for row MST graph of both groups). Described between-groups differences were confirmed in statistical comparisons regarding BCmax in beta band and regional betweenness centrality in gamma frequency (Table 2).

