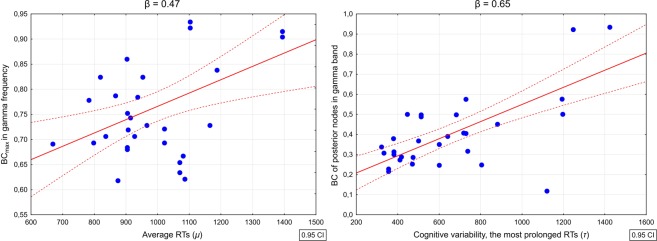
Figure 4.
Correlation plots showing relationships between selected neural networks metrics and the ex-Gaussian parameters characterizing the distribution of reaction times (RTs) derived from the cognitive speed task performed by patients with first-episode schizophrenia. Left panel represents correlations between maximal betweenness centrality in gamma frequency and the average RTs (μ parameter), while the right panel displays the correlation between the centrality of nodes localized in the posterior part of the cortex and the most prolonged RTs being an indicator of processing inconsistency (τ parameter). In both cases, depicted associations were significant also after controlling for duration of untreated psychosis, duration of illness and risperidone equivalent.

