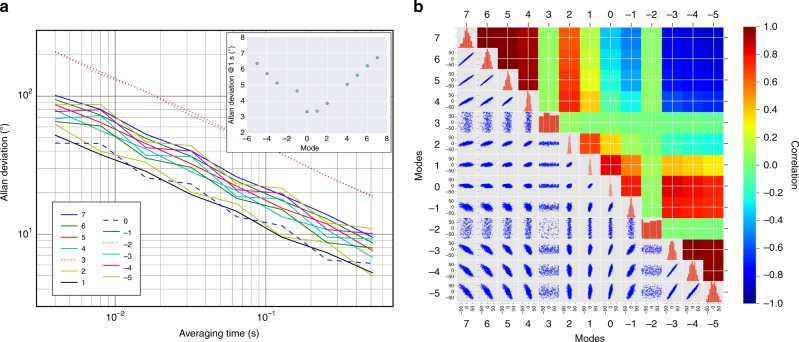
Fig. 5.
Phase noise analysis. a Allan variance analysis on the phase of each comb mode during a 2-seconds-long acquisition. The characteristic trends confirm that the measurements are affected by statistical noise. Inset: linear dependence of extrapolated Allan deviation at 1 s on the mode order. b Correlation analysis on the phases fluctuations. On the diagonal, the correlation matrix shows the distributions of each mode phase fluctuations. Under the diagonal, the mutual correlation scatterplots of the modal phases are presented, while the corresponding correlation coefficient, color coded, is presented in the upper part of the matrix. The correlation and anti-correlation among all modal phases (except for modes −2 and 3) confirms that the statistical noise detected is due to residual instabilities of the QCL-comb spacing

