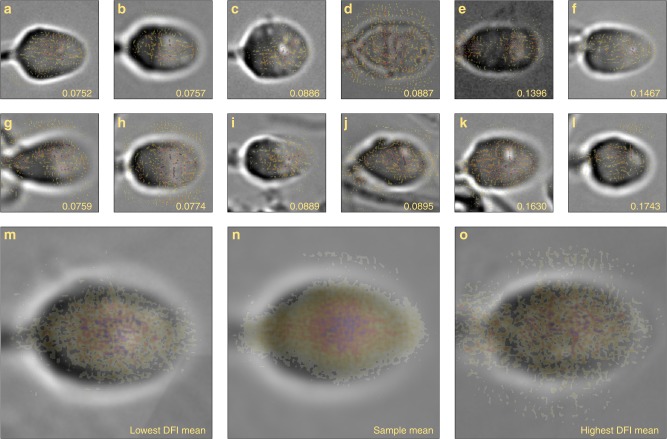
Fig. 5.
Bright-field cells images with saliency map overlay. The saliency map (color overlay) computes the gradient of the output category (DFI, given in bottom right corner) with respect to the input image (gray-scale background images), which highlights important features determined by the model. Specifically, we show examples of the (a, b, g, h) lowest 10% DFI cells with (m) the mean bright-field image of these cells and mean of the saliency maps overlaid, the (c, d, i, j) median 10% DFI cells with (n) mean bright field and saliency, and the (e, f, k, l) highest 10% DFI cells with (o) mean bright field and saliency for highest DFI cells. The dark intensity regions of the heat map indicate greater pixel importance. The model shows some background noise but primarily identifies internal features and places low value on undesirable features such as tails in the field of view that may not be associated with the sperm head of interest

