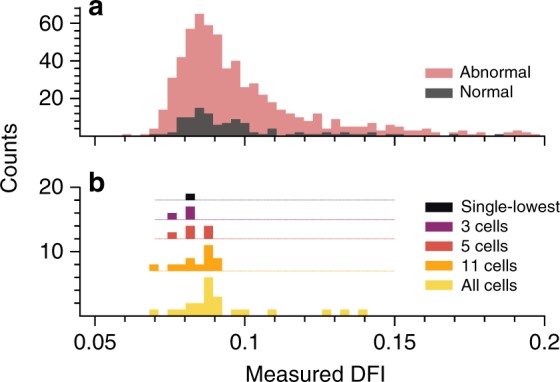
Fig. 6.

Normal versus abnormal DFI distribution and sub-group measured DFI. The histograms display DFI variation (a) over the entire dataset showing clinician classification of cells into abnormal and normal groups and (b) for one representative test set after training a model on only normal cells. The DFI values were truncated at 0.2 for ease of viewing due to the sparsity at higher DFI. a Performing the t-test for the medians of the normal and abnormal populations yields a p-value of 0.41, signifying that the medians are statistically the same. b The different cell quantities (i.e., 3 cells, 5 cells, etc.) illustrate the actual DFI values for the specific group of the predicted-lowest DFI cells
