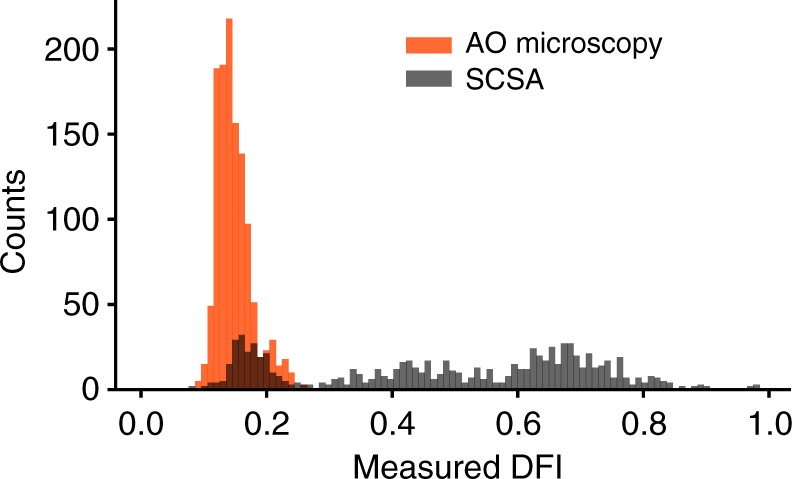
Fig. 7.

DFI histogram comparing recent single-cell DFI based on AO microscopy38 and traditional SCSA. A sample was split into two, and each half was analyzed independently via either method. Both methods yield DFI values based on AO intercalation, although AO microscopy does not capture higher DFI cells, due to differences in imaging, as well as the exclusion of debris, cell aggregates, and non-sperm species, none of which is excluded in traditional SCSA5
