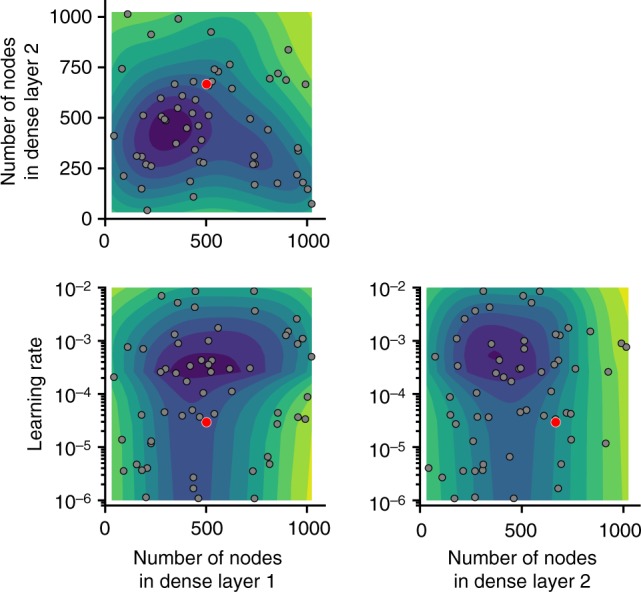
Fig. 8.

Results of Bayesian optimization using Gaussian processes, highlighting the influence of the number of nodes in final two fully connected layers and learning rate when optimizing for validation mean-squared error. The model was also optimized for activation function in the fully connected layers (ReLU, ELU, tanh), loss function (mean-squared error, mean-absolute error, and 90% quantile regression), as well as for batch normalization layers versus dropout layers (with different dropout rates), and, last, for Adam versus RMSprop optimizers. The optimized model (the model with the lowest error, as denoted by the red points) contained 502 nodes in the penultimate dense layer and 667 nodes in the final dense layer, used the ELU activation function and batch normalization between each dense layer, and was optimized via RMSprop for a learning rate of 2.9 × 10⁻⁵
