Figure 1.
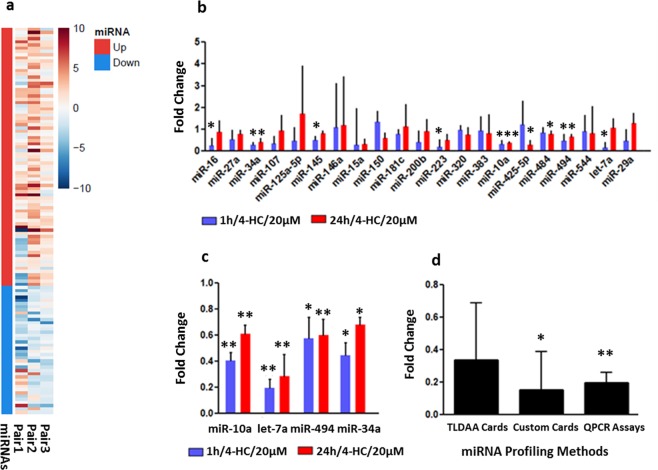
(a) Heatmap representation of 121 miRNAs expression in PND3 ovaries exposed to 4-HC for 1 h compared to control using Rodent TLDA Cards: 81 were upregulated (FC > 1.5) while the 40 were downregulated (FC < 0.5) after 1 hour exposure to 4-HC/20 µM. The experiments were repeated 3 times and the data analysis was performed by comparing miRNAs expression in paired groups (control-chemo exposed). The miRNAs and their expression levels are listed in the Supplementary Table S1. (b) Validation of the expression levels of selected miRNAs. Fold change of selected miRNAs which are differently expressed in PND3 ovaries after 1 h (N = 10) and 24 h (N = 6) exposure to 4-HC/20 µM compared to unexposed ovaries using TaqMan Custom Cards. The selected miRNAs and their expression levels are listed in the Supplementary Table S2. (c) Fold change of miR-10a, let-7a, miR-494 and miR-34a after individual QPCR validation in PND3 ovaries after 1 h and 24 h exposure to 4-HC/20 µM compared to unexposed ovaries. A minimum of 9 experiments have been performed per tested miRNAs. (d) Fold change of let-7a throughout all the miRNA expression profiling methods: TLDA cards (N = 3 pairs), Custom Cards (N = 10 pairs), QPCR Assays (N = 10 pairs). Fold change represents the geometric mean. The error bars represent the standard error. Significant differences compared to control are expressed as *p < 0.05, **p < 0.001 using paired t-test.

