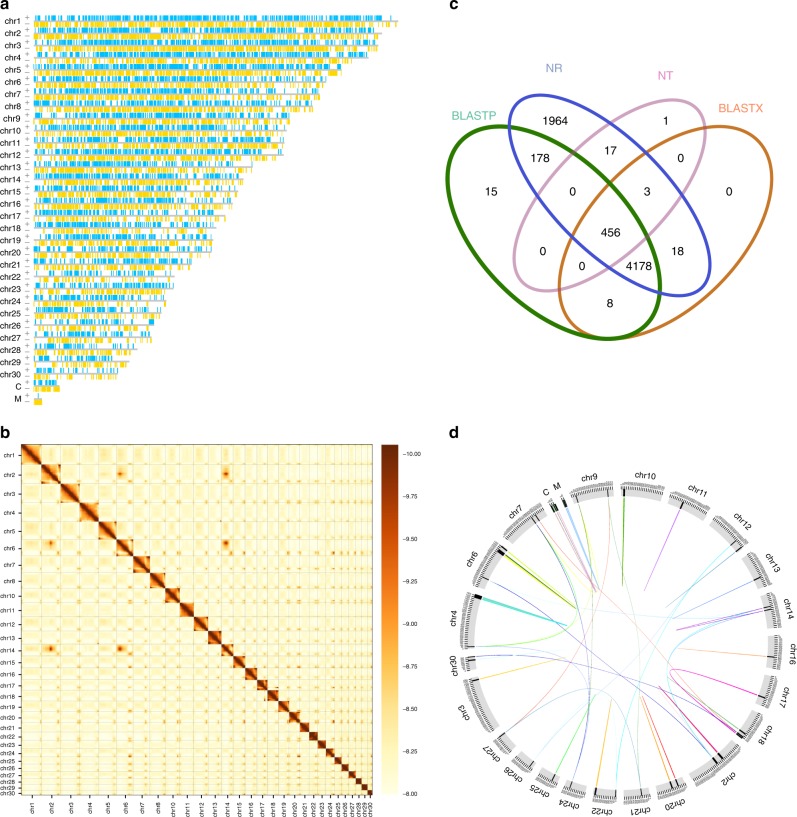
Fig. 1.
Protein-encoding gene models on each pseudochromosomes of N. oceanica. Mitochondrial and chloroplast pseudochromosomes are presented linearly but they can be circulated as their two ends contain the repeat assemblies of sequences. a The pseudochromosomes with gene models marked with vertical bars. The green bars represent gene models in the sense strand, while the yellow ones in the anti-sense strand of DNA. b The heatmap showing the interaction between 30 nuclear pseudochromosomes. c The Venn diagram of functional genes annotated against NT, NR, BLASTX, and BLASTP databases. d The similarity between nuclear pseudochromosomes. Less homozygosity is found among these pseudochromosomes, which is one of the characteristics of N. oceanica, genome reduction

