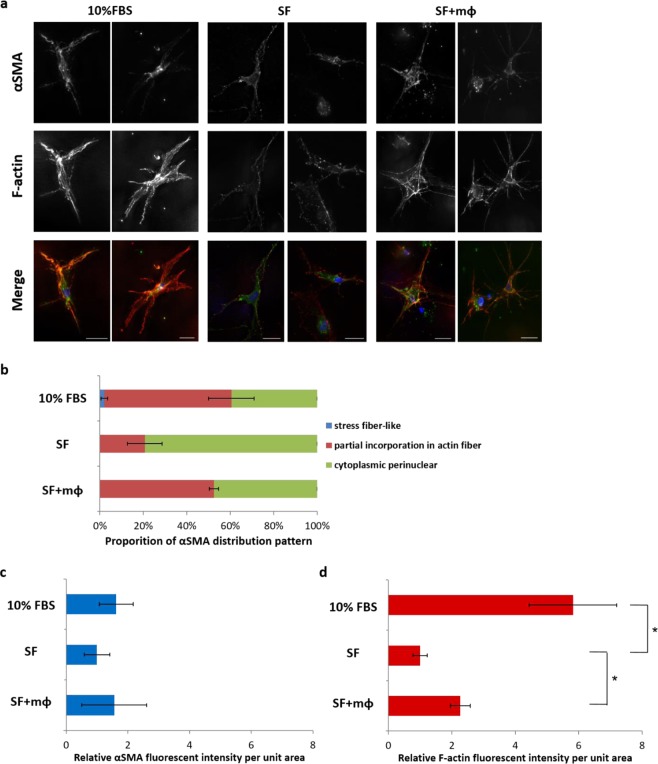
Figure 4.
Macrophages increased F-actin levels and αSMA incorporation in actin fibers. (a) Representative images of αSMA and F-actin staining in HO2 fibroblasts following 4 days culture in gels in the presence of 10% serum (10%FBS), and in serum-free medium without (SF) and with macrophages (SF + mΦ). Scale bar, 25 µm. Merge images show αSMA (green), F-actin (red), and DAPI (blue). (b) αSMA distribution patterns in HO2 fibroblasts (>100 cells, n = 3). (c,d) αSMA (c) and F-actin (d) levels in HO2 cells in gels in the presence of 10% serum, and in serum-free medium with/without macrophages; shown are fluorescence intensity measurements from maximum intensity projections normalized to the value of serum-free condition (n = 4, *p < 0.05, Mann-Whitney test).

