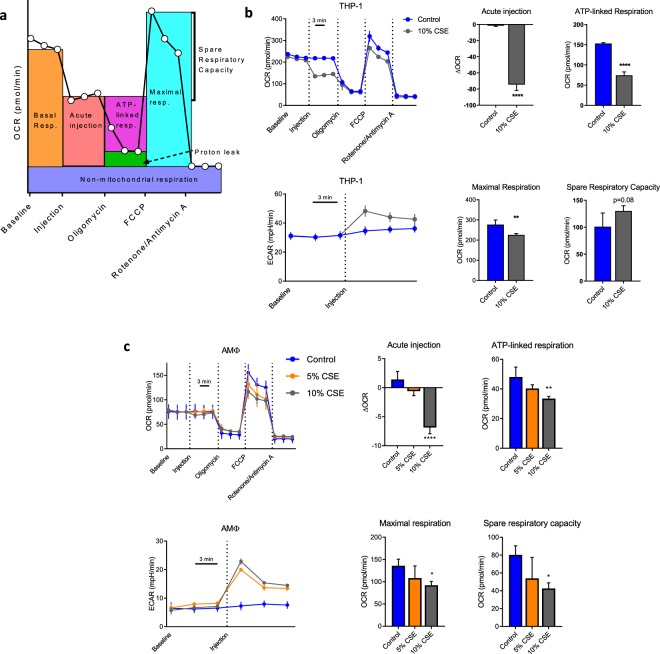
Figure 3.
CSE induces a shift in MΦ from oxidative to glycolytic metabolism. (a) Schematic of parameters measured in mitostress assay, adapted from63 (b) THP-1 derived MΦ were subjected to a Seahorse mitostress assay per manufacturer protocol. Either CSE or vehicle was added to injection port A of the Seahorse plate, with a final concentration of 10% after injection. Oligomycin (final concentration 1 μM), FCCP (0.5 μM) and Rotenone/antimycin A (0.5 μM each) were added to injection ports B, C and D. Oxygen consumption rate (OCR, top panel) and extracellular acidification rate (ECAR, right panel) were measured simultaneously three times each at baseline and after each serial injection with three minute intervals between measurements. 3–4 technical replicates per condition were run and mean ± s.d. are graphed, data are representative of three independent experiments. Bar graphs are data computed from OCR line graph with parameters as per a. All calculations were performed relative to values from a given well. **p < 0.01, ****p < 0.0001 by unpaired t-test. (c) Alveolar macrophages purified from a healthy volunteer and subjected to an identical mitostress assay as in (b), excepting that injection was with 5% or 10% CSE. Six technical replicates per condition were run and mean ± s.d. are graphed, data are representative of three unique experiments performed with cells from different donors. *p < 0.05, **p < 0.01, ****p < 0.0001 relative to control wells by ANOVA with Dunnett’s post-test.

