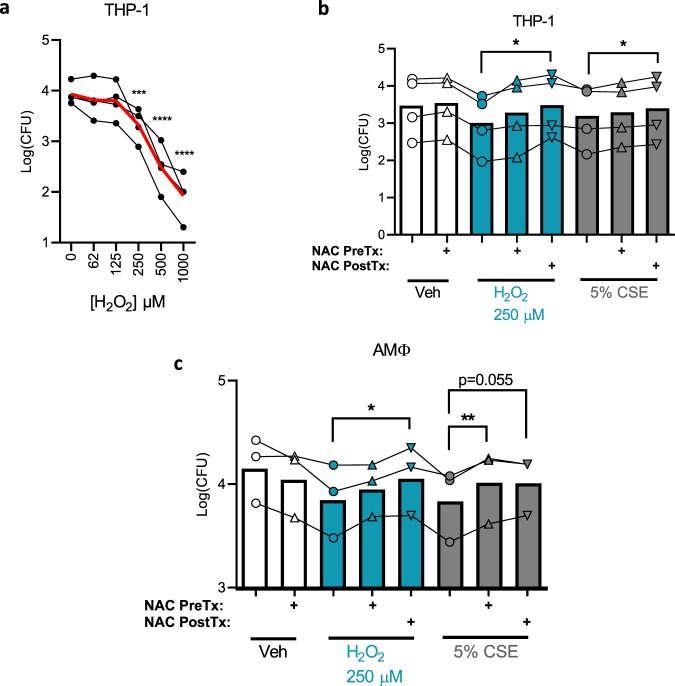
Figure 6.
Reactive oxygen species inhibit phagocytosis. (a) Phagocytosis was carried out as in Fig. 1 except varying doses of hydrogen peroxide were used to pre-treat cells for 30 min prior to infection. Phagocytosis generally decreases with increasing hydrogen peroxide concentration (p < 10−9, linear model). Means of four independent experiments are graphed (black dots) with the mean of all four experiments combined (red line). ***p < 0.001, ****p < 0.0001 compared with control by ANOVA with Dunnett’s post-hoc test. p < 10−9 for an effect of hydrogen peroxide concentration on phagocytosis as determined by linear modeling. (b) Phagocytosis assay similar to a except NAC 4 mM was added to indicated wells either 30 min before hydrogen peroxide/CSE (NAC PreTx) or 30 min after (NAC PostTx). Infection was started 30 min after post-treatment. Points represent means of four independent experiments each performed in triplicate, with bars indicating the overall means of the combined experiments. *p < 0.05 by paired t-test. (c) Identical phagocytosis assays to (b) were carried out using AMΦ from healthy donors, points represent means of three unique experiments from distinct donors each performed in triplicate, with bars indicating the overall means of the combined experiments. *p < 0.05, **p < 0.01 by paired t-test.

