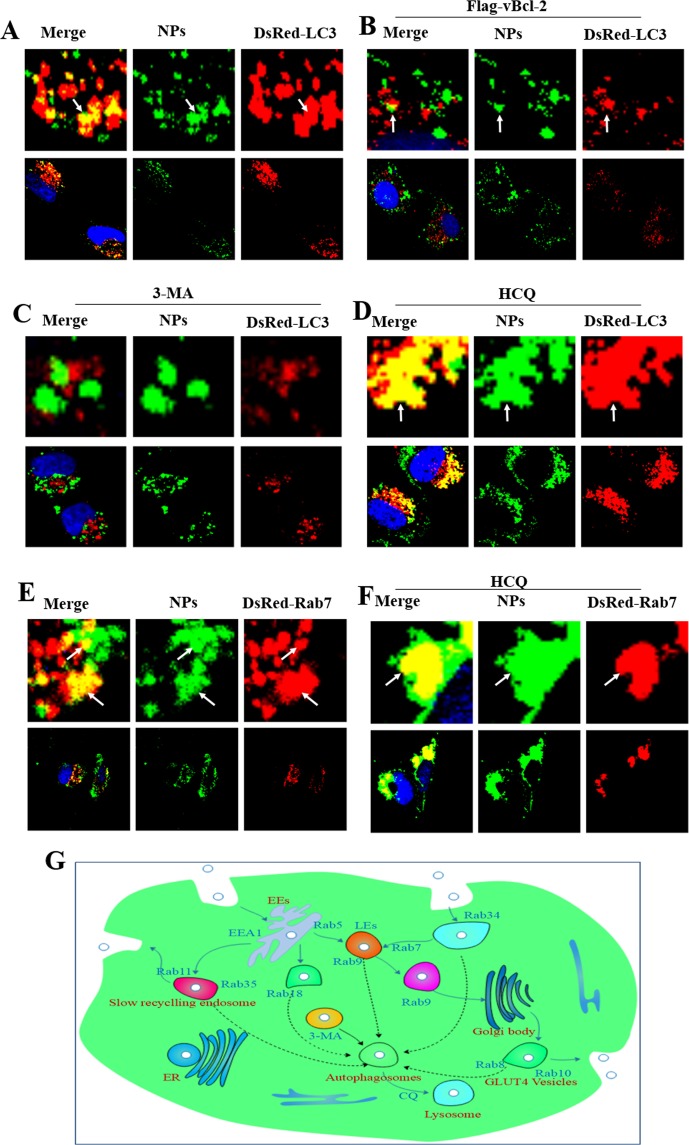
Figure 5.
Confocal microscopy pictures of inhibiting autophagy of NPs. (A,B) DsRed-LC3 cells were cultured with 1 mg/mL Coumarin-6-labeled NPs for 3 h; DsRed-LC3 cells were co-treated with Flag-vBcl-2 and 1 mg/mL Coumarin-6-labeled NPs for 3 h. (C,D) The DsRed-LC3 cells were cultured with 10 μM 3-MA or 30 μM CQ. (E,F) DsRed-Rab7 cells were cultured with 1 mg/mL Coumarin-6-labeled NPs for 3 h; the DsRed-Rab7 cells were cultured with 30 μM CQ. (G) Schematic diagram of NP degradation pathways in the intracellular network. The above images are the enlarged ones in the white collar on the underside images.

