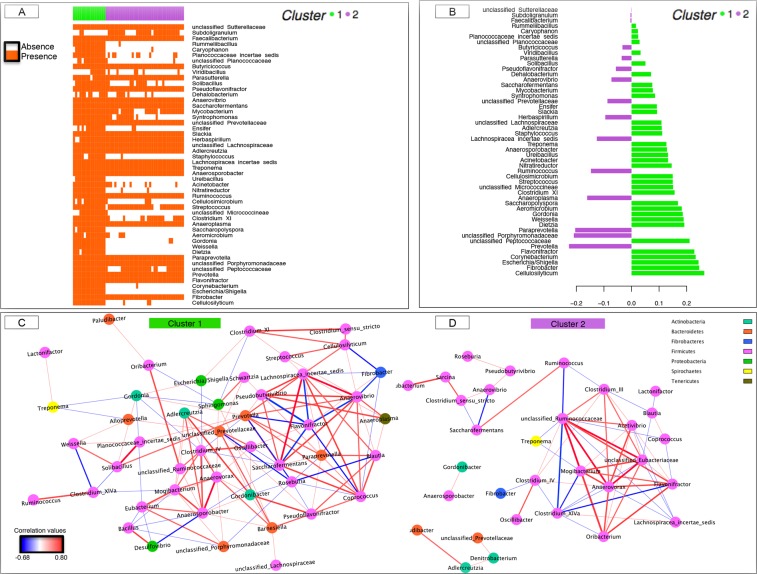
Figure 2.
Dynamics of gut bacterial genera between the two community types. (A) Matrix showing the presence or absence of the 50 most discriminating genera detected by partial least squares discriminant analysis (PLS-DA) model. Each entry in the matrix indicates the presence or absence of each genus in each individual. Individuals are grouped by community type. In the heatmap, orange = presence, white = absence; (B) The PLS-DA loading plot shows the contributing bacterial genera towards the separation of the PLS-DA scores between individuals of the community type 1 (green color) and community type 2 (purple color); (C,D) Co-occurrence network of the community type 1 and type 2, respectively. In all cases, the correlations among genera were calculated using the partial correlation and information theory (PCIT) method, which identifies significant co-occurrence patterns. The size of the node is proportional to genera abundance. Node fill color corresponds to phylum taxonomic classification. Edges colors represent positive (red) and negative (blue) connections. The edge thickness is equivalent to the correlation values. Only genera with a relative abundance >0.10 were included.

