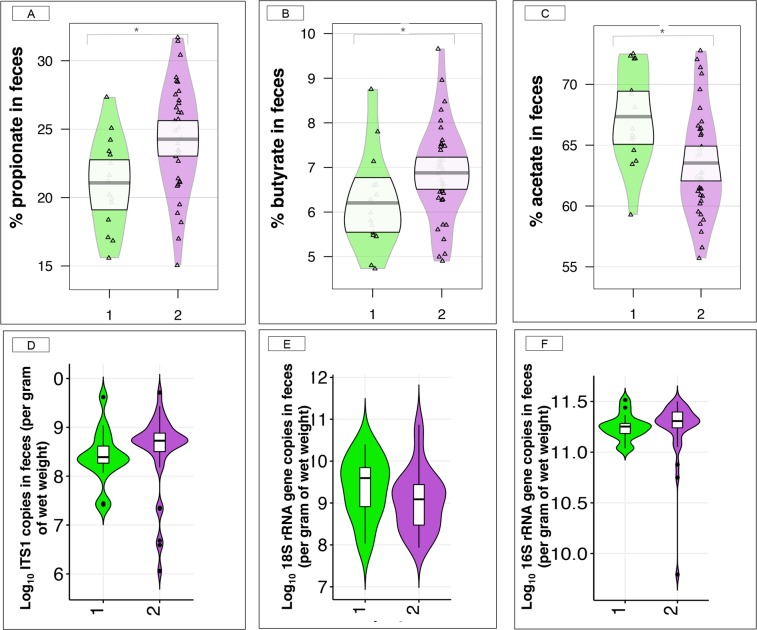
Figure 3.
Proportions of short chain fatty acids, and anaerobic fungal, protozoan and bacterial loads in feces of the two-gut microbiota community types. (A–C) Box plot of the proportion of short chain fatty acids that were significantly different between the community types 1 and community type 2 (Mann Whitney U test, adjusted p-value < 0.05), namely propionate, butyrate and acetate; (D–F) Box plot of anaerobic fungal, protozoan and bacterial loads in community type 1 and community type 2, respectively. In all cases, boxes show median and interquartile range, and whiskers indicate 5th to 95th percentile. The box color indicates the community type: community type 1 (green) and community type 2 (purple). * adjusted p-value < 0.05, Mann Whitney U test followed by Benjamini-Hochberg multiple test correction.

