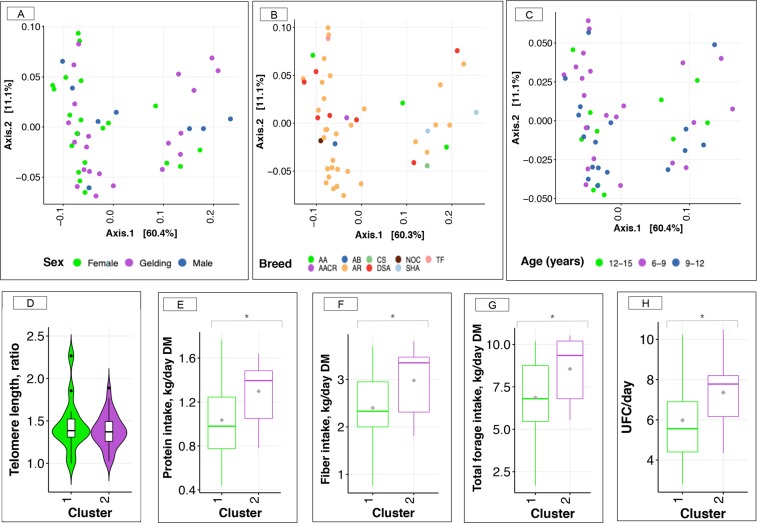
Figure 4.
Relationship between microbiota gut community types and host variables. (A–C) Principal coordinate analysis (PCoA) of gut microbiota composition with weighted-UniFrac distance as a function of sex, breed and category of ages. Within breed: AA (Anglo-Arabian), AB (barbe Arabic), CS (riding horse, half Arabian), NOC (Half Arabian, half unknown), TF (French trotter), AACR (cross breeding Anglo -Arabian), AR (Arabian), DSA (50% Arabian blood), and SHA (Shagya); (D) Box plot of telomere length in gut community types 1 and 2; (E–H) Box plot of estimated daily protein intake (kg), fiber intake (kg), the total forage intake (kg) and UFC intake in gut community types 1 and 2, respectively. The protein, fiber and forage intakes are expressed in dry matter bases. In all cases, boxes show median and interquartile range, and whiskers indicate 5th to 95th percentile. The box color indicates the community type: community type 1 (green) and community type 2 (purple).

