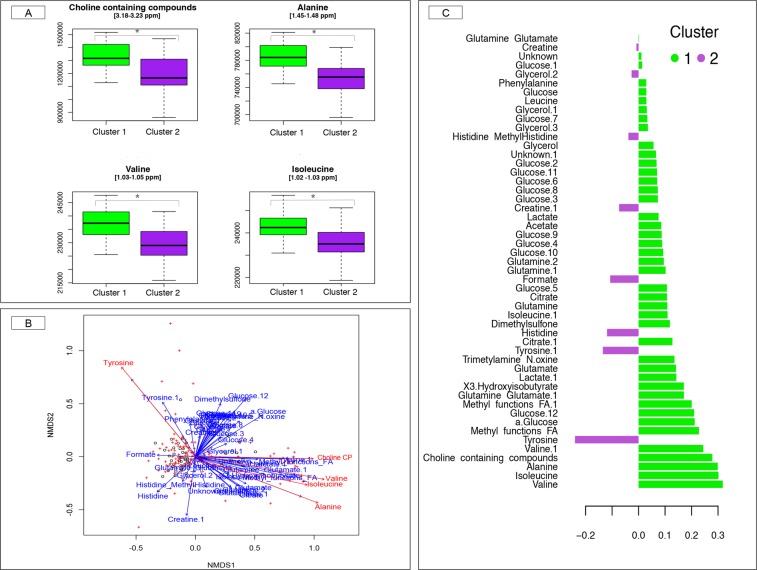
Figure 5.
Relationship between blood metabolome profile and gut microbiota at basal time. (A) Box plots of blood metabolites significantly different between the two communities’ types at basal time. Boxes show median and interquartile range, and whiskers indicate 5th to 95th percentile. The box color indicates the community type: community type 1 (green) and community type 2 (purple). * adjusted p-value < 0.10, Mann Whitney U test followed by Benjamini-Hochberg multiple test correction; (B) Covariates of microbiome variation were identified by calculation the association between basal metabolome profiles and genus-level community ordination (NMDS based on Bray-Curtis dissimilarity) with envfit function in the “vegan” R package (10,000 permutations, followed by Benjamini-Hochberg multiple test correction). Points represent the basal metabolites parameters, whereas crosses represent the relative genera abundance. The blue arrows indicate non-significant correlations with the ordination, whereas the red arrows indicate significant correlations; (C) The partial least squares discriminant analysis (PLS-DA) loading plot shows the contributing blood metabolites towards the separation of the PLS-DA scores between individuals of the community type 1 (green color) and community type 2 (purple color) at basal time.

