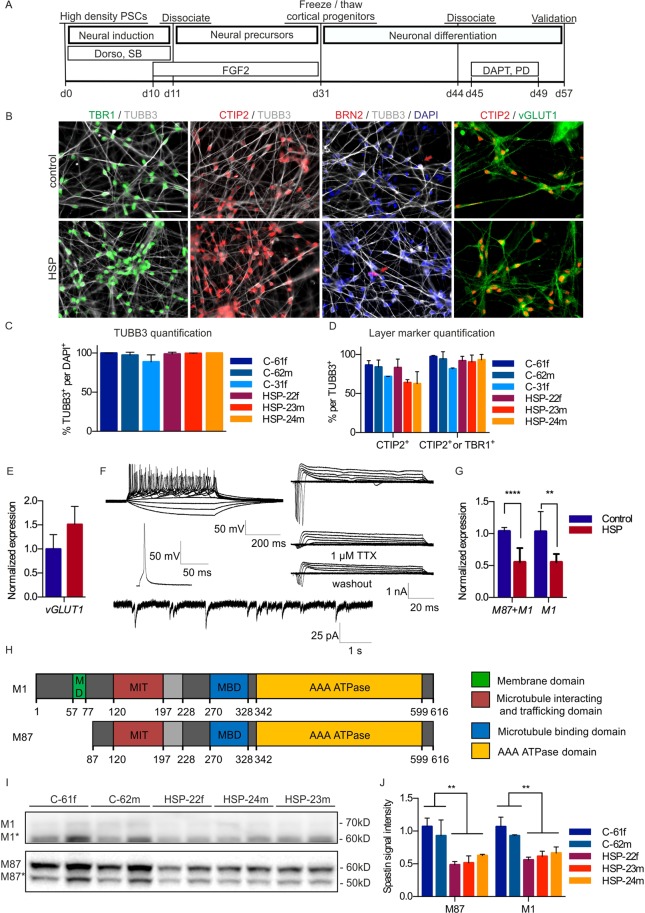
Figure 1.
Differentiation of iPSCs into cortical progenitors and cortical neurons. (A) Timeline of cortical differentiation. (B) Immunofluorescence staining against the cortical layer markers TBR1 and CTIP2 as well as the vesicular glutamate transporter 1 (vGLUT1) confirms identity of cortical neurons. Scale: 50 µm. (C) Immunofluorescence stainings of neuronal marker TUBB3 and (D) layer markers TBR1 and CTIP2 were quantified on day 57 (C-61f: n = 4, C-62m: n = 3, C-31f: n = 3, HSP-22f: n = 6, HSP-23m: n = 4, HSP-24m: n = 3, C61f: 97.3%, C62m: 94.1%, C31f: 81.5%, HSP22f: 92.0%, HSP23m: 93.1%, HSP24m: 90.3%). Error bars show SD. (E) Q-PCR analysis confirms vGLUT1 expression (control: n = 6, HSP: n = 6). (F) Top: Exemplary traces of multiple APs generated by 500 ms step-current injection (n = 4). Below: Single AP generated in response to 20 ms step-current injection. Right: Depolarising voltage steps elicited voltage-dependent TTX-sensitive fast inactivating inward and sustained outward currents (n = 7). Bottom: Representative trace of sPSC (n = 6). (G) Q-PCR of the M87 + M1 and M1 isoform of SPAST normalized to 18S levels and control (control: n = 6, HSP: n = 6). 2way Anova, **p < 0.01, ***p < 0.001. Error bars show SD. (H) Spastin is expressed as two major isoforms resulting from alternative translational start sites (M1 and M87) and two splice variants, in which exon 4 is skipped (M1* and M87*; exon 4 is shaded in light grey). (I) Spastin expression in control and SPG4 neurons. Western blot with spastin isoforms M87 and M87* after a short exposure time and M1 and M1* isoforms after prolonged exposure. To be able to show both isoforms, the M1 image had to be cut at the height of 60 kDa, to separate the M1 bands from the overexpressed M87 bands (for original Western blot data see Supplementary Fig. 6). (J) Quantification of isoforms M1 and M87 normalized to Ponceau total protein staining and control (C-61f: n = 4, C-62m: n = 4, C-31f: n = 4, HSP-22f: n = 4, HSP-23m: n = 4, HSP-24m: n = 4). Unpaired t-test, **p < 0.01. Error bars show SD. Figure adapted from corresponding PhD thesis72.

