Figure 4.
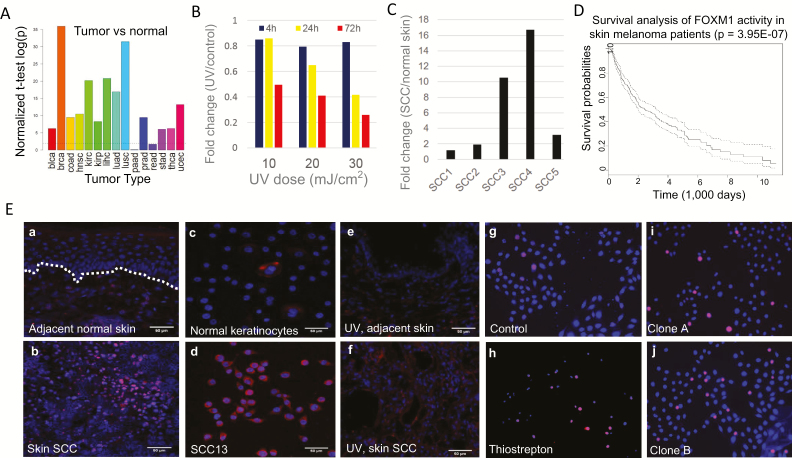
(A) Illustration of the average fold change in FOXM1 mRNA expression between human cancers and their respective normal control tissue. (B) Time- and dose-dependent changes in FOXM1 mRNA expression following UVR in primary human keratinocytes. (C) Fold change in FOXM1 mRNA expression between human SCCs and adjacent normal skin. (D) Inverse correlation between FOXM1 expression and melanoma patient survival time based on TCGA data. (E) FOXM1 protein expression in human SCC tumor tissue and adjacent normal skin from the same patient (a and b); FOXM1 protein expression in human SCC13 tumor cells and normal keratinocytes (c and d); FOXM1 protein expression in UV-induced mouse SCC tumor and adjacent control skin (e and f); Viability staining of control SCC13 cells (g), SCC13 treated with 5 μM thiostrepton (h) or with FOXM1-targeting CRISPR/Cas9 (i and j). Red: FOXM1 expression (a–f) or apoptotic cells (g–j). Blue: DAPI nuclei staining. The dotted white line in image 4E-a indicates the basement membrane between the epidermis and dermis.

