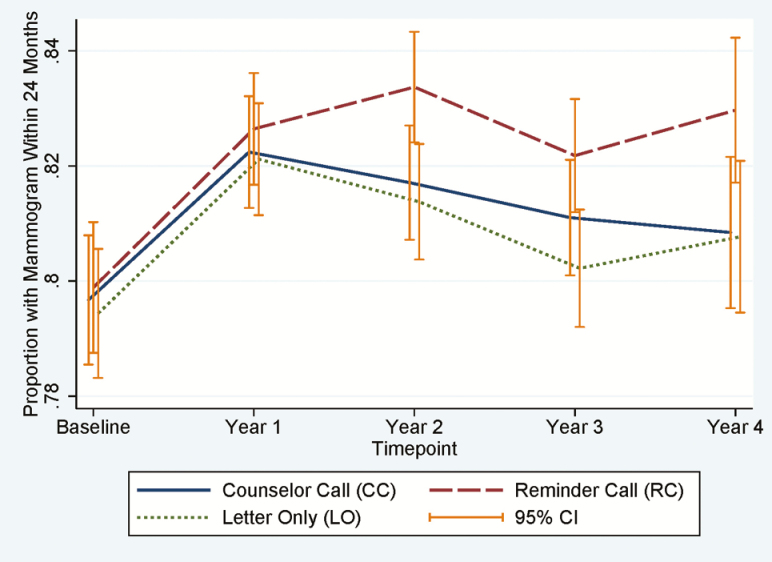
Fig 1.
Proportion of all active subjects with 24 months Fallon Health (FH) enrollment and a mammogram in the last 24 months by time point and study arm (baseline: n = 14,707; Year 1: n = 17,824; Year 2: n = 17,402; Year 3: n = 17,543; Year 4: n = 10,301). Error bars represent 95% confidence intervals.

