
Figure 1.
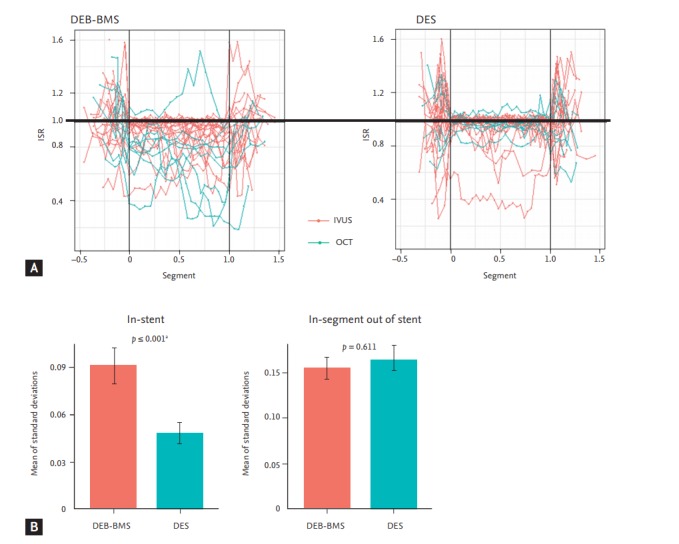
Neointimal hyperplasia and degree of restenosis at 9 months. (A) On the X axis, the proximal edge of the stent was regarded as 0, and the distal edge of the stent was set to 1. The degree of restenosis was plotted on the Y axis. (B) Mean of standard deviations of degree of restenosis “instent” (left panel) and “in-segment out of stent” (right panel). ISR, degree of in-stent or in-segment restenosis; DEB, drug-eluting balloon; BMS, bare metal stent; DES, drug-eluting stent; IVUS, intravascular ultrasonography; OCT, optical coherence tomography. a Two-way analysis of variance test.