FIGURE 6.

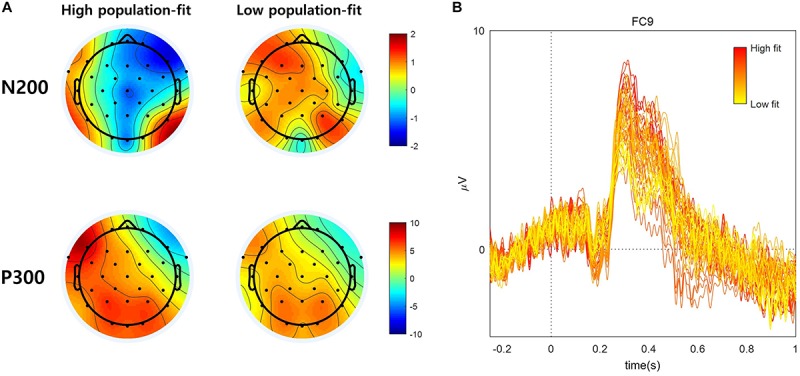
(A) EEG topographic map of high and low population-fit stimuli during N200 (170–230 ms) and P300 (270–330 ms). (B) Fifty ERP subsets according to the ratio of high-fit response at the left frontal area (i.e., FC9).

(A) EEG topographic map of high and low population-fit stimuli during N200 (170–230 ms) and P300 (270–330 ms). (B) Fifty ERP subsets according to the ratio of high-fit response at the left frontal area (i.e., FC9).