
Figure 2.
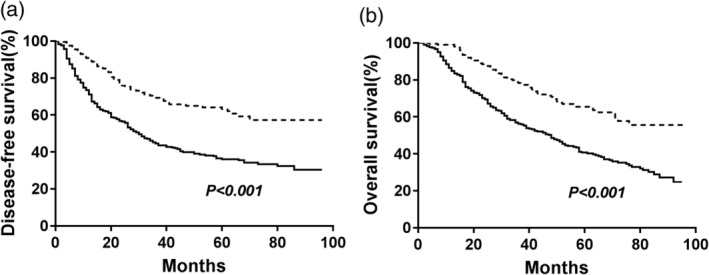
Kaplan‐Meier analysis of DFS and OS stratified by preoperative AAPR value in patients with NSCLC. (a) Effect of AAPR on DFS; (b) Effect of AAPR on OS. P‐values were calculated by the log‐rank test. ( ) <0.64 and (
 ) ≥0.64.
Official websites use .gov
A
.gov website belongs to an official
government organization in the United States.
Secure .gov websites use HTTPS
A lock (
) or https:// means you've safely
connected to the .gov website. Share sensitive
information only on official, secure websites.
Kaplan‐Meier analysis of DFS and OS stratified by preoperative AAPR value in patients with NSCLC. (a) Effect of AAPR on DFS; (b) Effect of AAPR on OS. P‐values were calculated by the log‐rank test. () <0.64 and () ≥0.64.