
Figure 5.
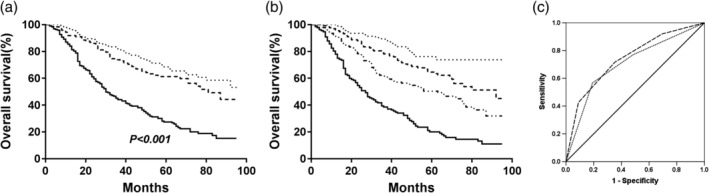
Kaplan‐Meier curves of OS. (a) Effect of the TNM staging system on the OS in all NSCLC patients (AUC = 0.706, 95% CI = 0.660–0.752); TNM ( ) I, (
 ) II, and (
 ) III. (b) Effect of the AAPR‐TNM system on OS in all NSCLC patients (AUC = 0.742, 95% CI = 0.699–0.785). AAPR‐TNM (
 ) 1, (
 ) 2, (
 ) 3, and (
 ) 4. (c) ROC analysis of the TNM staging system and the AAPR‐TNM system in OS prediction. (
 ) AAPR‐TNM, (
 ) TNM, and (
 ) Reference line.