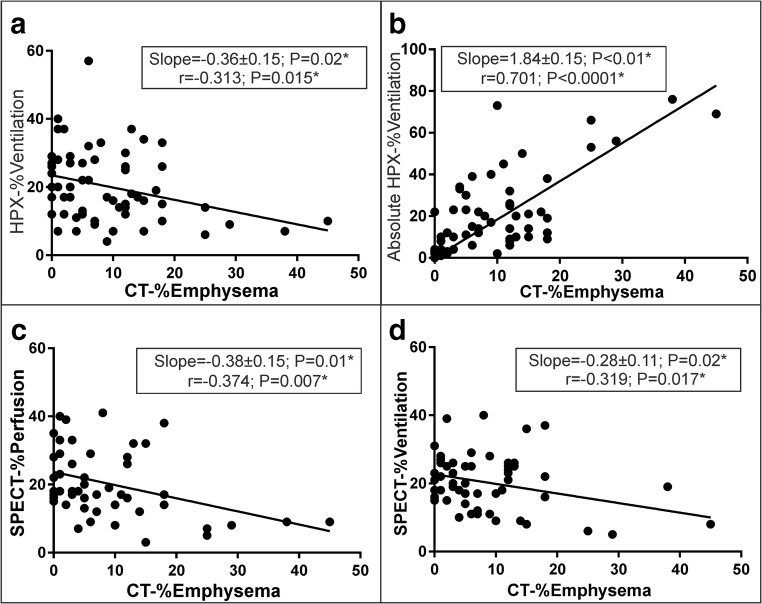
Fig. 3.
The linear regression of the lobar scores between the absolute CT-%emphysema and the relative HPX-%ventilation, the absolute HPX-%ventilation, SPECT-%perfusion, and SPECT-%ventilation are shown in a–d over the entire COPD patient population including the liner regression lines, slope, and p values

