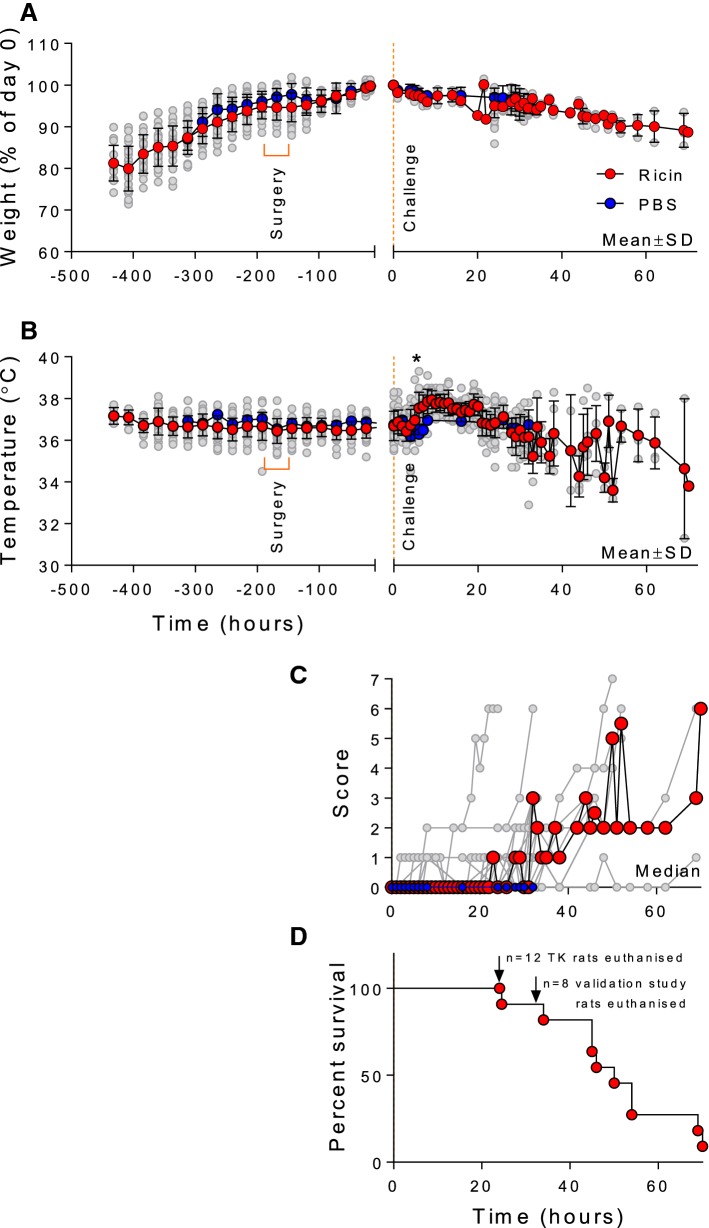
Fig. 1.
Effect of ricin exposure on bodyweight, temperature, signs of intoxication and survival. Data from up to 31 ricin-exposed rats are shown as mean ± SD (panel A and B) and median for Panel C (red data points) and for individual rats (grey data points in all panels) for bodyweight (panel A), body temperature (panel B) and clinical score (panel C). Data for PBS-exposed rats are shown as blue data points as mean ± SD and median only. Bodyweight data are normalised to t = 0, the time-point at which the ricin (8 µg·kg−1 i.v.) challenge was administered. Clinical scores data (panel C) are calculated from those rats alive at each time point. On reaching the humane endpoint (score = 8) or the end of the study (see panel D) rats are excluded from this analysis. Survival data for all animals in the study are shown in panel D, planned euthanasia at the experiment end-point is indicated and these animals were censored from the analysis. *Statistically significant difference between PBS and corresponding ricin-exposed animals in the validation study, p < 0.001 and p < 0.01 at 6 and 8 h respectively, 2-way ANOVA and Sidak’s multiple comparisons test

