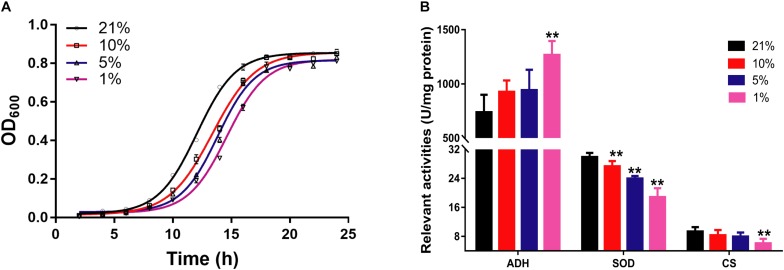
FIGURE 1.
The pathophysiological changes of S. cerevisiae in hypoxic stress. (A) The OD600 values of cell at different times in different oxygen concentrations (n = 3, mean ± SD). (B) The enzyme activities of ADH, SOD, and CS (n = 7, mean ± SD). ∗∗P < 0.01: different oxygen concentrations compared with 21%.

