FIGURE 3.
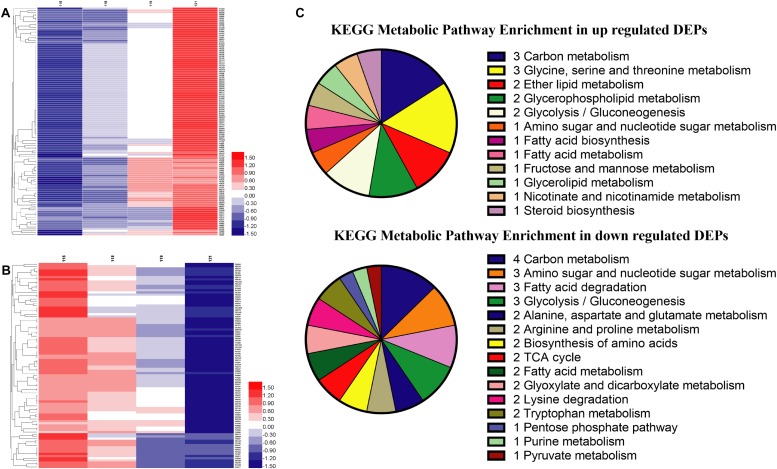
The proteins levels and enrichment analysis in the proteomics. (A) The heatmap of gradually up-regulated DEPs in different groups. (B) The heatmap of gradually down-regulated DEPs in different groups. The red indicated a high expression and the blue showed a low expression. (C) The distributing diagram of gradually up-/down-regulated DEPs in the metabolic pathway.

