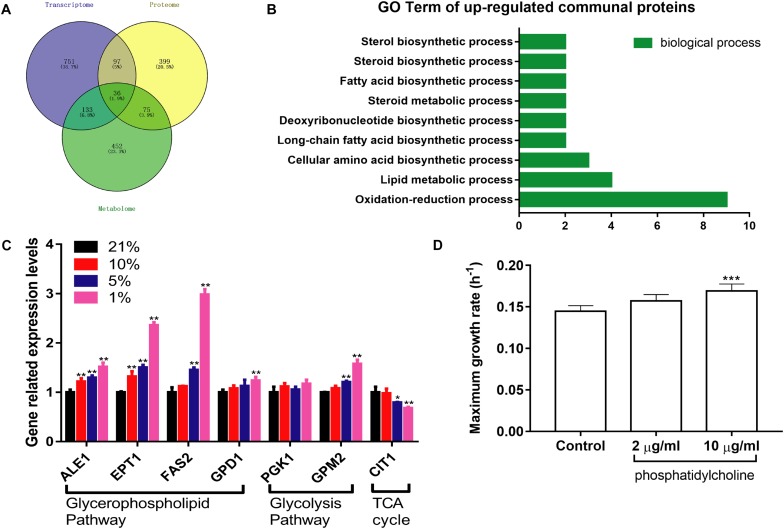
FIGURE 6.
The integrated analysis and verification of multi-omics data. (A) The Venn diagrams of communal and key proteins in transcriptomics, proteomics, and metabolomics. (B) The biological process of GO analysis of 19 up-regulated communal and key proteins. (C) The expression levels of relevant mRNA in different oxygen concentrations (n = 3, mean ± SD). *P < 0.05, ∗∗P < 0.01: different oxygen concentrations compared with 21%. (D) The maximum growth rate of PC at different concentrations under the Hpx1 condition (n = 5, mean ± SD). ∗∗∗P < 0.001: 10 μg/mL PC compared with the control group.

