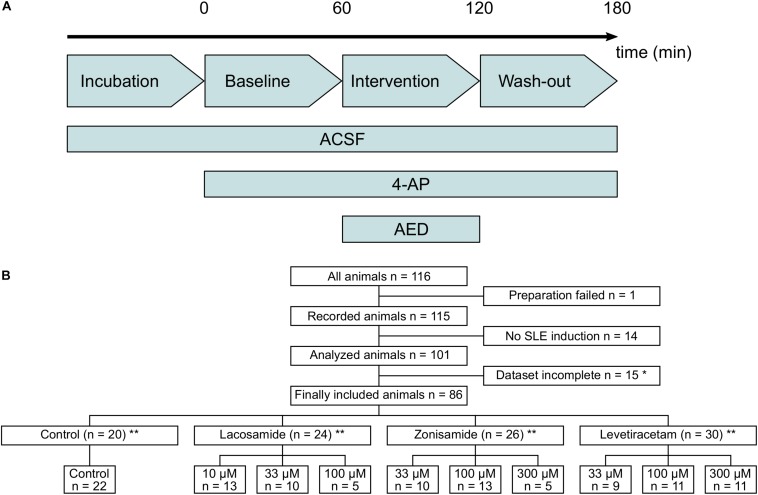
FIGURE 1.
Flow diagram of used laboratory animals and experimental protocol. (A) Timeline of the experimental protocol. The duration of baseline, intervention, and wash-out ranged between 40 and 60 min. (B) Flow diagram of all laboratory animals used in the study and their allocation to the different intervention groups. Animals with too long preparation, failed SLE induction or incomplete dataset (*mostly due to failure of recording before end of the experimental protocol) were excluded from the study. ∗∗In few cases, two slices from one animal were used and assigned to different groups. Numbers in lower panel therefore indicate number of slices and in sum might exceed number of animals given above.

