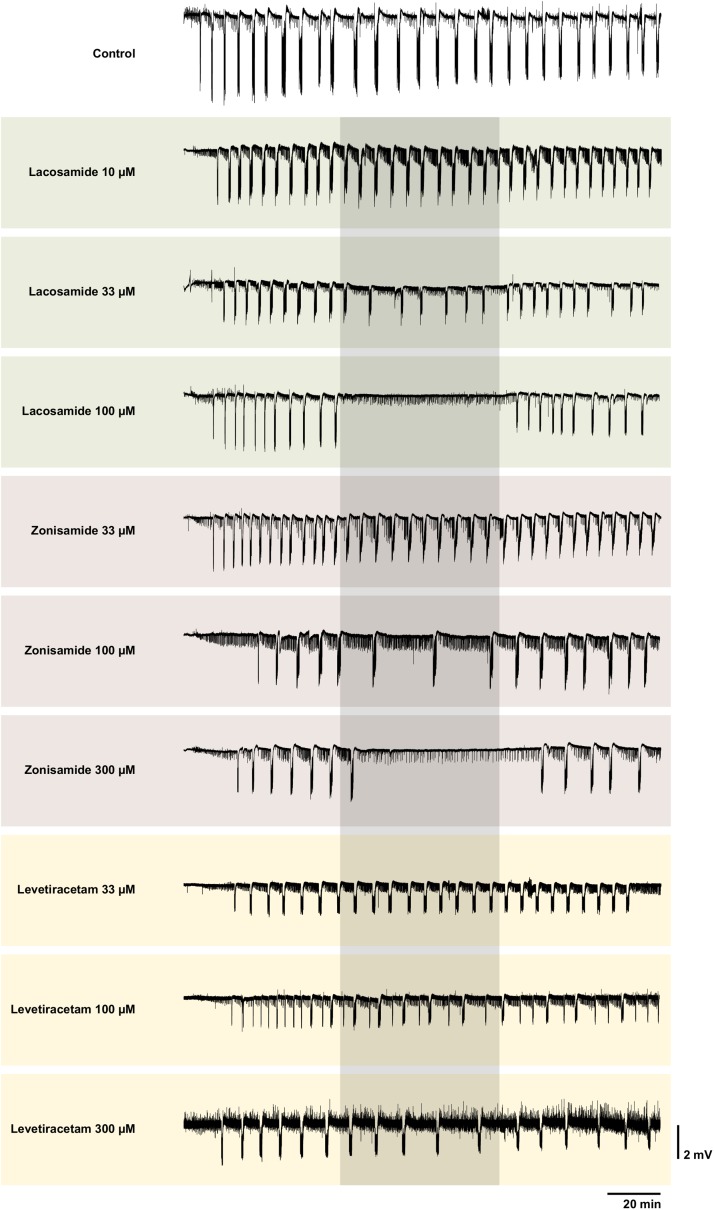
FIGURE 2.
Representative local field potential recordings of control and all intervention groups. Each trace shows a complete recording of the local field potential in EC beginning with the wash-in of 4-AP. The grayish box marks the time window of the intervention with the AED. Note the complete SLE block with LAC 100 and ZNS 300 μM. Though interictal like events were not analyzed systematically, one can clearly see different patterns of their representation. In some recordings, the interictal like events seem to increase during intervention (e.g., LAC 100 μM), in some no visible changes can be observed (e.g., ZNS 100 μM) and in others their frequency seems to be reduced (ZNS 300 μM). Overall there was no obvious clear effect. For better visualization, slow drifts were removed.

