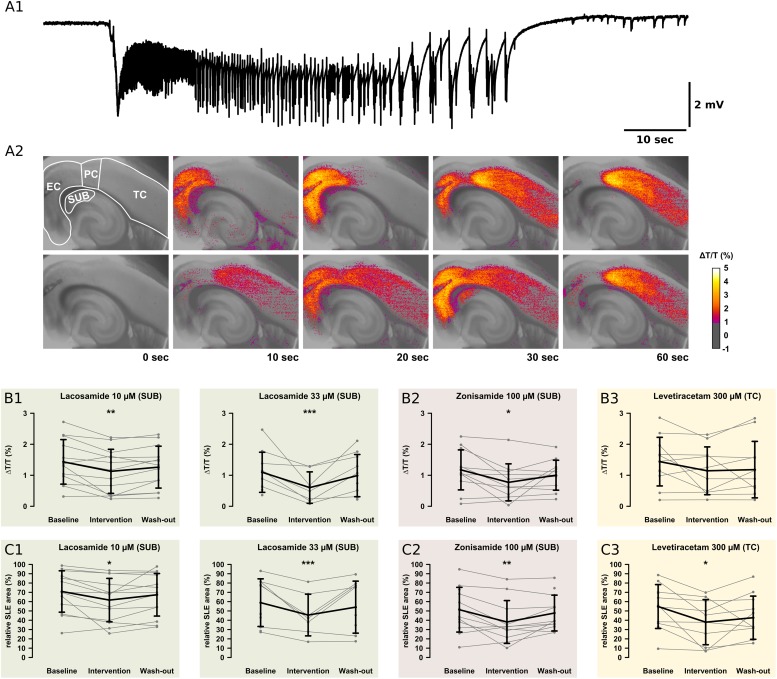
FIGURE 5.
Recordings of the IOS. For analysis of the onset zone, spread, and local intensity of the SLEs, the IOS was recorded simultaneously to local field potentials. As described in previous studies, the SLEs started in different regions within the same slice. Note the relatively small area of the SUB. (A1) The electrophysiological recording shows a representative SLE from the EC. After the onset with a sharp transient there is a tonic phase resting about 10 s. This goes over into the clonic phase, which lasts about 50 s. (A2) The pictures show the color-coded IOS intensity over time during an SLE. In the upper row, the SLE starts in the EC and then continuously spreads mainly to the PC and TC. In the lower row, the SLE starts in the PC and then spreads vice versa to the TC and EC. In the SUB, LAC (B1,C1) and ZNS (B2,C2) reduce the IOS intensity and the size of the area the SLE is spreading to. The third AED, LEV, reduces the SLE area but not IOS intensity in the TC (B3,C3). All effects are reversed at the end of the wash-out. Asterisks indicate significant decrease of IOS intensity or SLE area compared to baseline (*p < 0.05, ∗∗p < 0.01, ∗∗∗p < 0.001).

