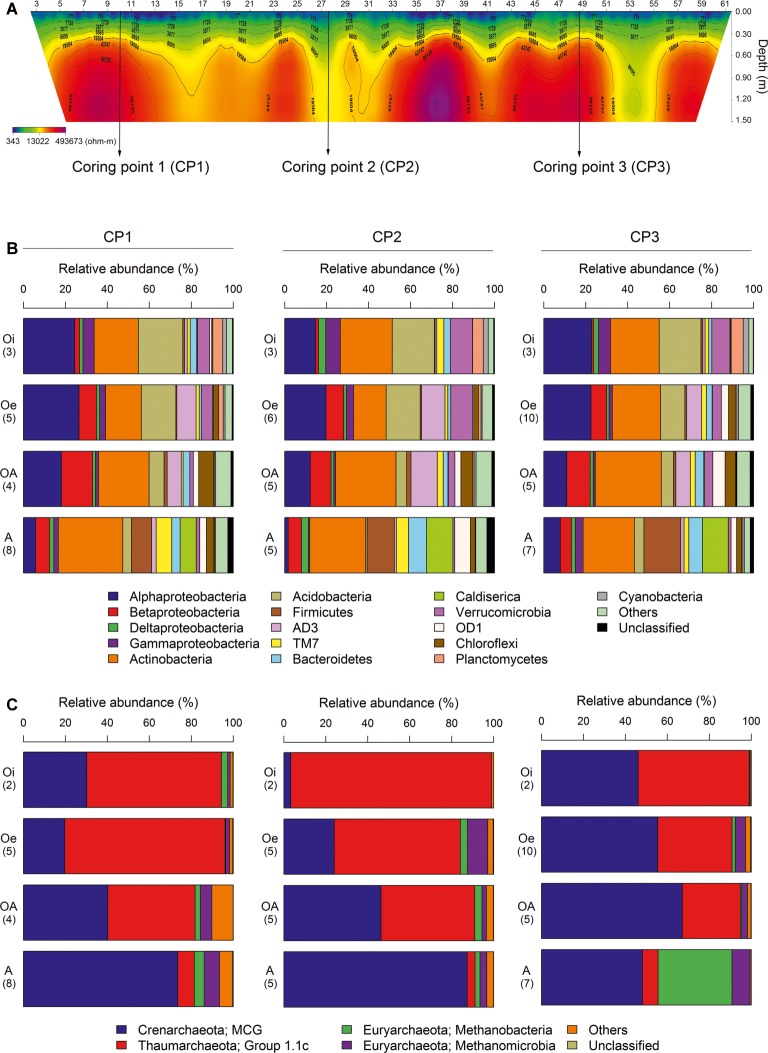
Figure 1.
(A) The 2D-electrical resistivity tomographic (ERT) survey result of three coring points. Average relative abundance of dominant (B) bacterial and (C) archaeal taxa associated with different horizons of soil cores sampled from three coring points. Number of samples analyzed in each horizon is given in brackets.

