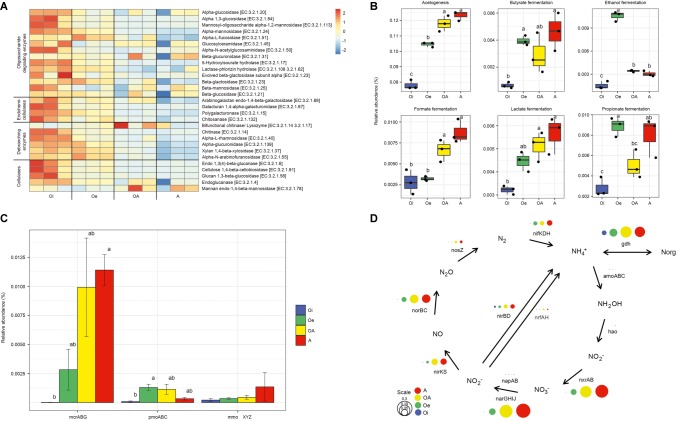
Figure 6.
Genetic potential for carbon and N metabolism in different horizons of permafrost soil cores. (A) Heatmap of scaled relative abundance of genes encoding carbohydrate-active enzymes (CAZymes). (B) Relative abundance of genes involved in acetogenesis and fermentation. (C) Relative abundance of genes encoding sub-units of key enzymes involved in methanogenesis (methyl coenzyme M reductase, mcrABG) and methanotrophy (particulate methane monooxygenase-pmoABC and soluble methane monooxygenase-mmoXYZ). (D) Relative abundance of genes associated with N cycle. The circle size corresponds to the relative abundance of each gene.

