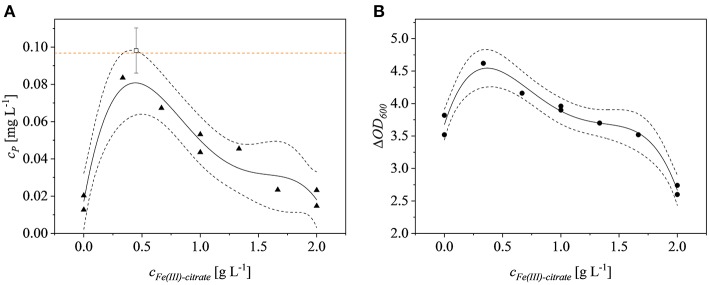
Figure 2.
Fe(III)-citrate optimization. (A) Product concentration of the model runs (▴) and of the confirmation runs (□). The orange dotted line represents the product concentration achieved in LB complex medium with no additional Fe(III)-citrate. (B) ΔOD600 (•) at the time of harvest is dependent on the Fe(III)-citrate concentration. Dotted black lines represent the confidence bands (95%) of the plotted model (solid line).

