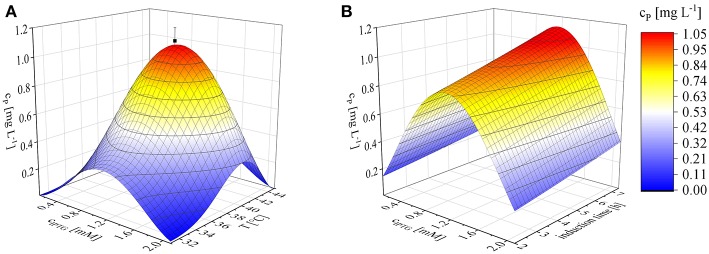
Figure 3.
Optimization of induction to maximize the recombinant protein concentration (cP) using Equation (12), shown as 3D plots. (A) Concentration of inducer against temperature after induction for 6 h. (B) IPTG concentration against the duration of induction at a constant temperature of 40°C. Confirmation runs (■) under the optimal conditions predicted by the model were performed using biological triplicates.

