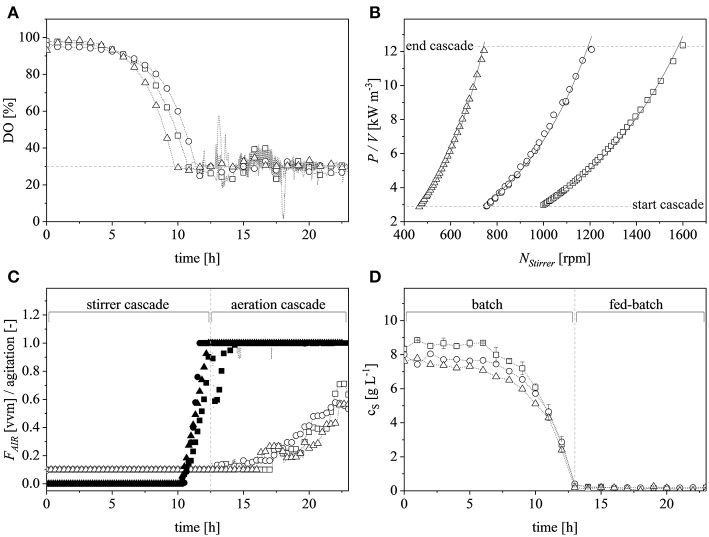
Figure 4.
Scaling up by applying the combined criteria of constant dissolved oxygen (DO) levels and matching volumetric power input (P/V) at the limits of the stirrer cascade at the 0.5 L (□), 7.5 L (°) and 20 L (Δ) scales. (A) DO trends at the different scales during the course of cultivation. The dashed gray line represents the scale-up criteria of 30% DO. (B) P/V plotted against the agitation of the stirrer at the corresponding scale. The dashed gray lines show the cascade limits whereas the solid black lines show the exponential fits (R2 > 0.99 for all scales). (C) Normalized stirrer agitation over the course of a representative cultivation at the 0.5 L (■), 7.5 L (•), and 20 L (▴) scales, and after reaching the end of the cascade (dashed gray line) the subsequent aeration cascade over the course of a representative cultivation at the 0.5 L (□), 7.5 L (°), and 20 L (Δ) scales. (D) Glucose concentration over the course of a representative cultivation in the supernatant of the 0.5 L (□), 7.5 L (°), and 20 L (Δ) scales. Gray, dashed, vertical line depicts the total glucose depletion and therefore the start of the exponential feed profile.

