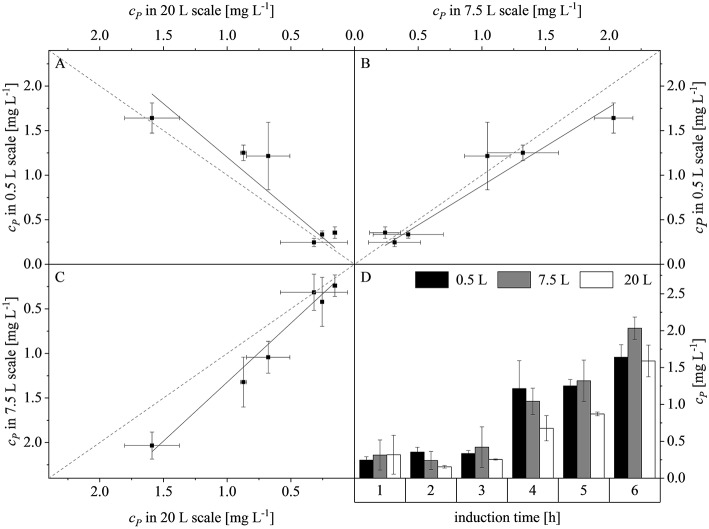
Figure 7.
Concentration of recombinant protein (cP) compared among the production scales and during the course of induction. (A) Parity plot of cP at the 20 and 0.5 L scales (adj. R2 = 0.93, with a slope of 1.20). (B) Parity plot of cP at the 7.5 and 0.5 L scales (adj. R2 = 0.98, with a slope of 0.88). (C) Parity plot of cP at the 7.5 and 20 L scales (adj. R2 = 0.99, with a slope of 1.32). Solid black lines show the linear fits and dashed gray lines represent lines of parity. (D) Trend of cP during induction at the 0.5, 7.5, and 20 L scales.

